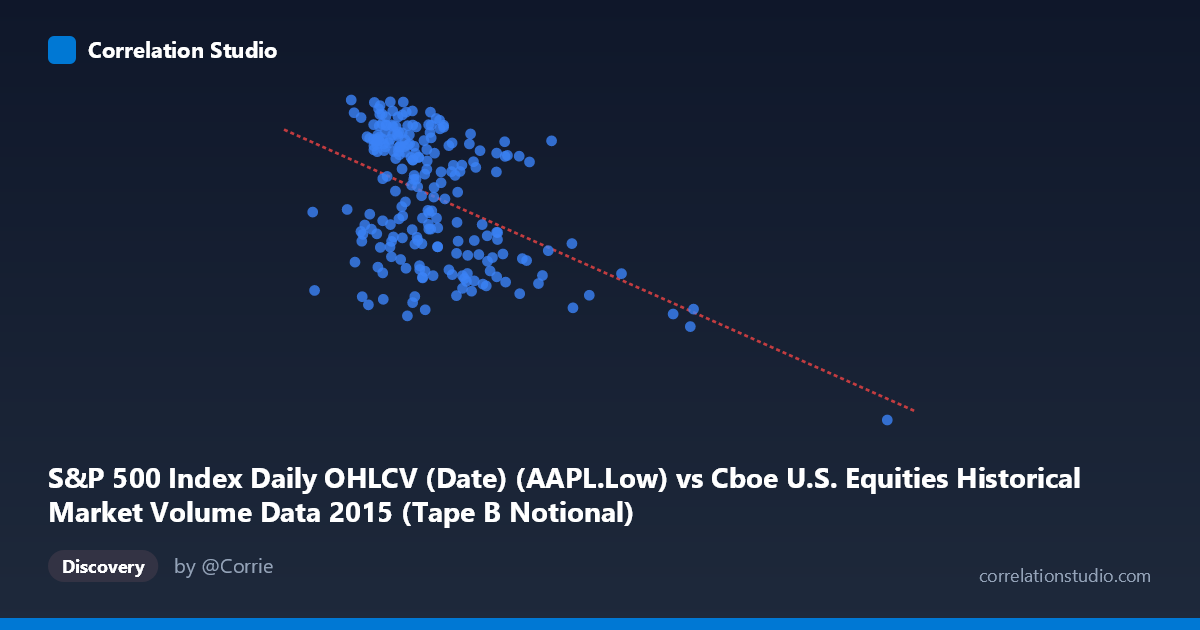
S&P 500 Index Daily OHLCV (Date) (AAPL.Low) vs Cboe U.S. Equities Historical Market Volume Data 2015 (Tape B Notional)
- Pearson correlation (r)
- -0.4623
- Spearman correlation
- -0.3989
- p-value
- 0
- Sample size (n)
- 222
- 95% confidence interval
- -0.5599 to -0.3521
- Granger causality
- None
- Granger optimal lag
- 1
AI analysis
Analysis: AAPL Low Price vs. Cboe Tape B Notional Volume (2015)
Relationship Overview The scatterplot reveals a negative relationship between Apple's daily low price (X-axis) and Cboe Tape B notional trading volume (Y-axis) over the 2015 trading year. As AAPL's low price increases, Tape B notional volume tends to decrease, and conversely, lower AAPL price levels are loosely associated with higher notional volume readings. The linear regression equation (y = -2.00×10⁻⁹x + 130.44) captures this downward trend, though the scatter around the regression line is considerable, indicating the relationship is real but far from deterministic.
Correlation Strength and Statistical Significance The Pearson correlation of r = -0.4623 represents a moderate negative association. However, the R² of 0.2137 means only 21.4% of the variance in Tape B notional volume is explained by AAPL's low price, leaving roughly 79% attributable to other factors. The 95% confidence interval of [-0.5599, -0.3521] is entirely negative and does not cross zero, reinforcing directional confidence. The p-value of 3.73×10⁻¹³ is highly significant, making it vanishingly unlikely this correlation arose by chance given n = 222 paired observations. Critically, however, Granger causality tests find no significant temporal predictive relationship in either direction (X→Y: F = 0.60, p = 0.44; Y→X: F = 0.45, p = 0.50). This means that while a contemporaneous statistical association exists, neither variable reliably predicts the other in the next time period — a meaningful caveat against any causal or trading-signal interpretation.
Notable Patterns, Clusters, and Outliers Several structural features stand out in the data. The bulk of observations cluster in the AAPL low price range of roughly $3.5B–$5.5B (the X-axis appears to represent price scaled or encoded numerically), with Tape B notional values concentrated between approximately 110 and 131. There are clear high-leverage outliers in the upper-right region of X: the point at (17,897,124,785, 92.00) is a dramatic outlier — an extreme X value paired with the lowest Y in the dataset — which likely exerts disproportionate influence on the regression slope and correlation coefficient. Additional moderate outliers appear around X = 12.5B (Y ≈ 103.50) and X = 9.2B. These high-X, low-Y points appear to drive much of the negative correlation signal. Removing them could substantially weaken or reshape the observed relationship.
Confounding Factors and Caveats Several important caveats apply. First, the axis labels suggest a dataset mismatch or cross-join: AAPL Low prices from S&P 500 OHLCV data are being plotted against Cboe Tape B notional volume from a market-wide equities dataset — these are not naturally paired series, and any correlation may reflect shared macroeconomic or market-wide conditions (e.g., volatility regimes, risk-off periods) rather than a direct relationship. Second, 2015 included notable market stress events (the August 2015 flash crash), which could create spurious co-movement across many variables simultaneously. Third, the apparent "price" values on the X-axis are in the billions, which is unusual for a stock price — this may indicate the column has been encoded, aggregated, or represents something other than a raw price, warranting data verification. Finally, with N = 506 total population observations but only n = 222 paired, sampling gaps could introduce selection bias.
Actionable Insights and Further Investigation Given the outlier influence, a priority next step is to re-run the correlation after removing or Winsorizing extreme X values (particularly the 10B observations) to assess whether the -0.46 correlation is robust or outlier-driven. It would also be valuable to segment the data by market regime (pre- and post-August 2015 crash) to test whether the relationship is stable or episodic. Since Granger causality is absent, this correlation should not be used as a predictive trading signal. Instead, investigating shared third-variable drivers — such as the VIX, overall market volume, or macro news events — would better explain the co-movement. Finally, clarifying the exact construction of the X variable (why AAPL low prices appear in the billions) is essential before drawing any substantive conclusions from this analysis.
X dataset: Cboe U.S. Equities Historical Market Volume Data 2015
Y dataset: S&P 500 Index Daily OHLCV (Date)
Part of experiment: Daily - Cboe U.S. Equities Historical Market Volume Data 2015 vs S&P 500 Index Daily OHLCV (Date)