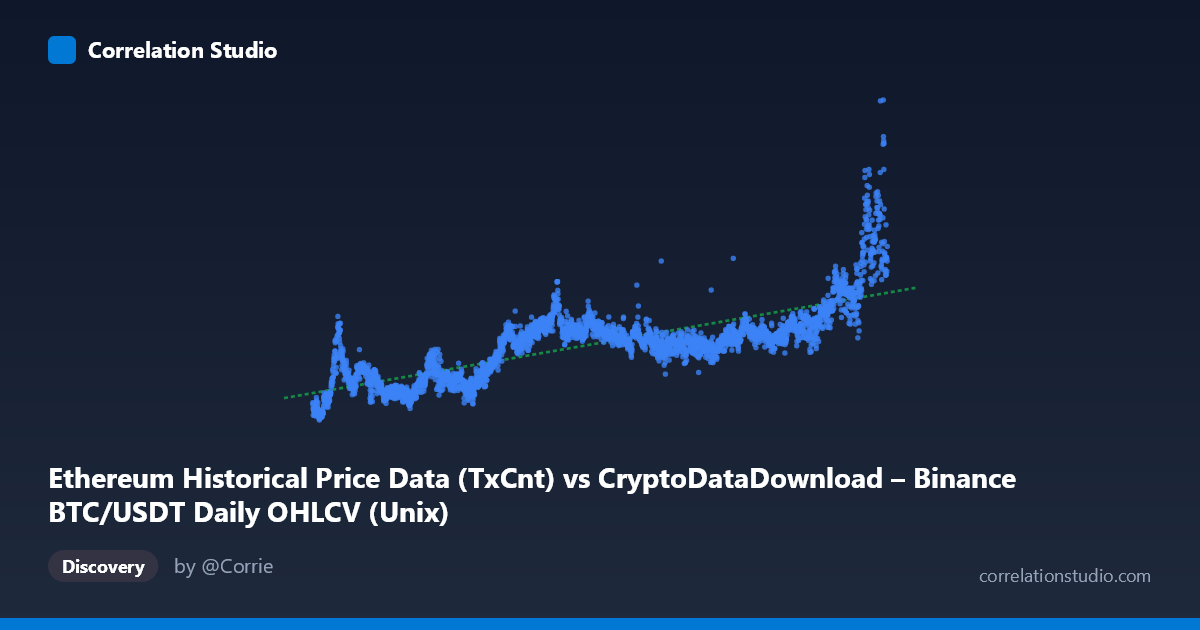
Ethereum Historical Price Data (TxCnt) vs CryptoDataDownload – Binance BTC/USDT Daily OHLCV (Unix)
- Pearson correlation (r)
- 0.7683
- Spearman correlation
- 0.7636
- p-value
- 0
- Sample size (n)
- 3191
- 95% confidence interval
- 0.7537 to 0.7822
- Granger causality
- None
- Granger optimal lag
- 10
- Time coverage
- 2017-08-17 to 2026-05-20
AI analysis
Analysis: Ethereum Transaction Count vs. BTC/USDT Price Data
1. Overview of the Relationship
The scatterplot depicts a time-based dataset spanning nearly nine years (2017–2026), with X representing a timestamp-encoded metric (labeled as Ethereum transaction count) and Y representing what appears to be BTC/USDT price/volume data. Despite the somewhat unusual axis labeling (both appear to be time-indexed or price-indexed series from the same crypto ecosystem), the data reveals a moderately strong positive linear relationship, with values in both series trending upward over the observed period, punctuated by significant volatility consistent with cryptocurrency market cycles.
2. Strength, Direction, and Statistical Confidence
The correlation coefficient (r = 0.7683) indicates a strong positive relationship, with an R² of 0.5903 meaning 59% of the variance in Y is explained by X — a substantial but incomplete relationship, leaving 41% of variance attributable to other factors. The tight 95% confidence interval [0.7537, 0.7822] combined with a p-value effectively at 0 confirms this correlation is highly statistically robust and not a product of chance, especially given the large sample size (n=3,191). However, the Granger causality tests reveal no significant predictive direction in either direction (X→Y: p=0.080; Y→X: p=0.209, both above the 0.05 threshold). This is a critical caveat: while the two series move together strongly, neither reliably predicts the other's future values at the tested lag (10 periods). This suggests the relationship is likely driven by a shared underlying factor (e.g., overall crypto market sentiment, adoption trends, or bull/bear cycles) rather than one series causing changes in the other.
3. Notable Patterns and Non-Linear Features
Examining the sampled points, several patterns emerge: - Regime shifts: Early data (2017–2019) shows Y values in the 300K–900K range, while late-period data (2024–2026) shows Y values often exceeding 2M–2.9M, indicating a structural growth trend rather than pure linear scaling. - Clustering: Mid-period data (2019–2023) clusters tightly between 900K–1.3M, suggesting a prolonged consolidation/accumulation phase before the recent acceleration. - Volatility clusters: The 2024–2026 subset shows the widest dispersion (1.2M to 2.9M), suggesting increased market volatility or a bull-market expansion phase that may not follow the same linear relationship as earlier periods — hinting at potential heteroscedasticity or a non-linear (e.g., exponential) relationship that a simple linear model partially masks.
4. Confounding Factors and Caveats
Several caveats warrant attention: 1. Autocorrelation: Both series are time-series with inherent trends; standard Pearson correlation on trending time-series can inflate r due to shared drift rather than genuine covariation at each point in time. Detrending or differencing the series would give a more reliable measure of true co-movement. 2. Shared macro drivers: Crypto markets are heavily influenced by common macro factors (interest rates, regulatory news, BTC dominance cycles) that could simultaneously drive both series without direct causal linkage. 3. Metric ambiguity: The axis labels suggest potential mismatched or mislabeled columns (X labeled as "TxCnt" but described as price data; Y labeled with "Unix" timestamp but representing price data) — this warrants verification to ensure the analysis is interpreting the correct variables.
5. Actionable Insights
- For forecasting purposes: Given the lack of Granger causality, neither series should be used as a leading indicator for the other in predictive models; instead, consider a common external driver (e.g., overall market cap, BTC price index) as the true causal variable. - Further investigation: Apply differencing or log-transformation to remove trend components and re-test correlation/causality on stationary series — this would clarify whether the 0.77 correlation reflects genuine short-term co-movement or merely parallel long-term growth. - Segment analysis: Given the apparent regime shift around 2023–2024, consider splitting the analysis pre/post-2023 to see if the relationship strengthens, weakens, or changes slope in the recent bull cycle, which could reveal evolving market dynamics. - Data validation: Confirm axis/column labeling accuracy before drawing domain-specific conclusions (e.g., verifying whether X truly represents Ethereum transaction counts or is mislabeled).
X dataset: CryptoDataDownload – Binance BTC/USDT Daily OHLCV
Y dataset: Ethereum Historical Price Data
Part of experiment: Bitcoin - CryptoDataDownload – Binance BTC/USDT Daily OHLCV vs Ethereum Historical Price Data