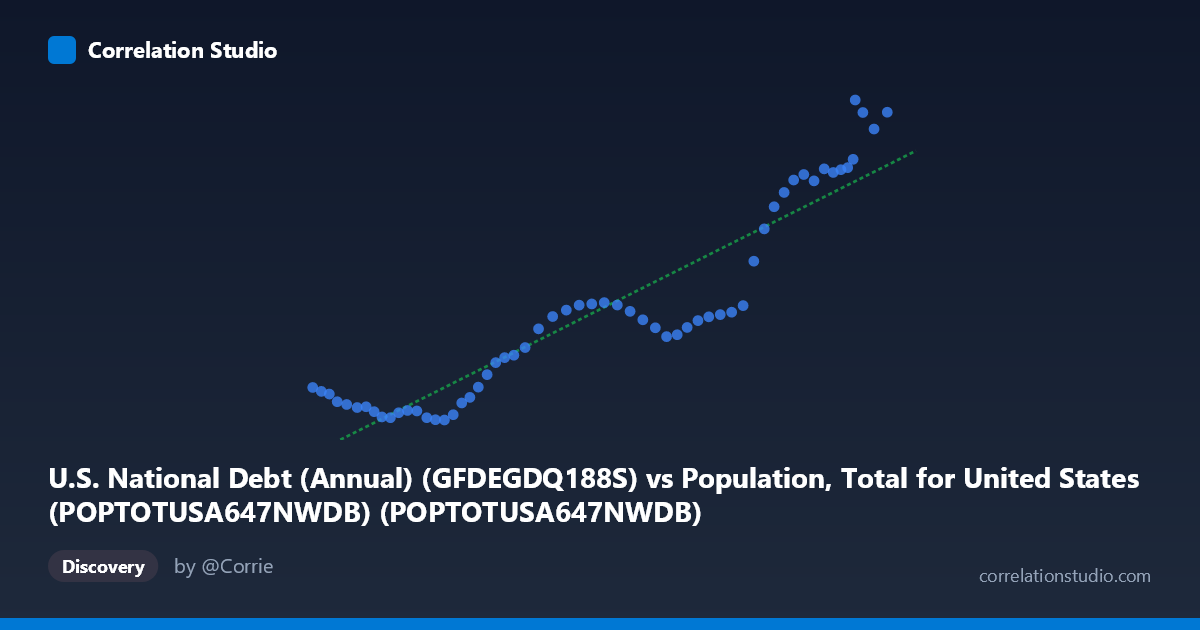
U.S. National Debt (Annual) (GFDEGDQ188S) vs Population, Total for United States (POPTOTUSA647NWDB) (POPTOTUSA647NWDB)
- Pearson correlation (r)
- 0.9257
- Spearman correlation
- 0.9138
- p-value
- 0
- Sample size (n)
- 59
- 95% confidence interval
- 0.8776 to 0.9553
- Granger causality
- None
- Granger optimal lag
- 10
AI analysis
Analysis: U.S. Population vs. National Debt as % of GDP (1966–2024)
1. Overall Relationship
The scatterplot reveals a strong positive association between U.S. total population and federal debt as a percentage of GDP across the 58-year observation window. As population has grown from roughly 197 million to 340 million, debt-to-GDP has climbed from approximately 31% to over 124%. The linear regression equation (y = 5.849×10⁻⁷x − 93.87) captures a meaningful upward trend, though the relationship is not perfectly linear — the scatter suggests that while population growth and debt accumulation have broadly co-occurred over time, they do not move in lockstep uniformly across all periods. Both variables are fundamentally time-indexed, which is critical context for interpreting their apparent association.
2. Correlation Strength and Statistical Framing
The Pearson correlation of r = 0.9257 is strikingly high, and the R² of 0.857 means that approximately 85.7% of the variance in debt-to-GDP is statistically explained by population size within this sample. The 95% confidence interval for r is [0.8776, 0.9553], which is tight and excludes zero comfortably, and the p-value is effectively zero, confirming the correlation is not a chance artifact. However, these statistics must be interpreted with significant caution: both variables are driven overwhelmingly by the passage of time itself, making a spuriously high correlation almost mathematically inevitable. The Granger causality results are unambiguous in their null finding — neither variable predictively leads the other in a statistically meaningful way (X→Y: F = 0.725, p = 0.695; Y→X: F = 1.171, p = 0.350, both far from significance even at a generous threshold). This means the correlation, however strong numerically, carries no demonstrated temporal predictive power in either direction.
3. Notable Patterns, Clusters, and Non-Linearity
Three visually distinct clusters emerge in the scatterplot:
- Lower-left cluster (population ~197M–250M, debt ~31%–52%): Corresponds roughly to the late 1960s through early 1990s — a period of relatively stable or declining debt-to-GDP, reflecting post-WWII fiscal consolidation and Cold War era growth. - Middle transition zone (population ~250M–305M, debt ~55%–65%): A relatively flat "plateau" where population grew substantially but debt-to-GDP remained compressed in a narrow band (~55–65%), suggesting fiscal dynamics were decoupled from population growth during this period (likely the 1990s–2000s economic expansion and surplus era). - Upper-right cluster (population ~305M–340M, debt ~77%–124%): A steep re-acceleration of debt-to-GDP corresponding to the post-2008 financial crisis, COVID-19 pandemic spending, and structural deficit growth — with several high-leverage points above 100% GDP that pull the regression line sharply upward.
The plateau in the middle range is a notable non-linearity that a single linear model does not adequately capture, and the upper-right cluster includes visible outliers near 120–124% that exert disproportionate influence on regression coefficients.
4. Confounding Factors and Interpretive Caveats
The most critical caveat is shared time-trend confounding: both population and national debt are monotonically (or near-monotonically) increasing over time. Any two such series will correlate highly regardless of causal connection — this is a textbook case of spurious correlation driven by common temporal trajectory. Numerous third variables — GDP growth rates, interest rate cycles, war expenditures, entitlement program expansions, tax policy changes, recessions (2001, 2008, 2020), and political administration priorities — are far more plausible direct drivers of debt-to-GDP than population size per se. Additionally, the optimal Granger lag of 10 periods suggests the model was searching extensively for predictive structure and still found none, reinforcing that the correlation is associative rather than mechanistic. The sample covers only annual data points (n=59 from N=65), which limits the granularity available to detect structural breaks.
5. Actionable Insights and Further Investigation
Despite the lack of causal inference, several investigative directions are worthwhile:
- Partial out time as a covariate: Re-run the correlation after detrending both series (e.g., first-differencing or HP filtering) to isolate whether population changes correlate with debt-to-GDP changes, which would be a far more meaningful test. - Segment analysis: Test the correlation separately within each identified cluster (pre-1990, 1990–2008, post-2008) to quantify whether the relationship strengthens, weakens, or reverses across fiscal regimes. - Substitute per-capita debt: Replace raw population with debt per capita or debt-to-GDP decomposed by demographic age structure (dependency ratio), which would introduce theoretically motivated mechanistic pathways (e.g., aging population → higher entitlement spending → higher debt). - Multivariate modeling: Include GDP growth, unemployment rate, and federal tax receipts as covariates to isolate whether population retains any independent explanatory power after controlling for macroeconomic fundamentals. - Structural break testing: Apply Chow or Bai-Perron tests to formally identify the regime shifts visible in the scatterplot, particularly around 2008 and 2020, before drawing any policy-relevant conclusions.
Bottom line: The correlation is statistically robust but almost certainly spurious as a causal claim. Both variables are driven by time itself, and the Granger causality analysis confirms no temporal predictive relationship in either direction. The real analytical value lies in understanding why debt-to-GDP accelerated dramatically in specific periods despite relatively steady population growth — and that answer lies in fiscal policy, not demography.
X dataset: Population, Total for United States (POPTOTUSA647NWDB)
Y dataset: U.S. National Debt (Annual)
Part of experiment: Yearly - Population, Total for United States (POPTOTUSA647NWDB) vs U.S. National Debt (Annual)