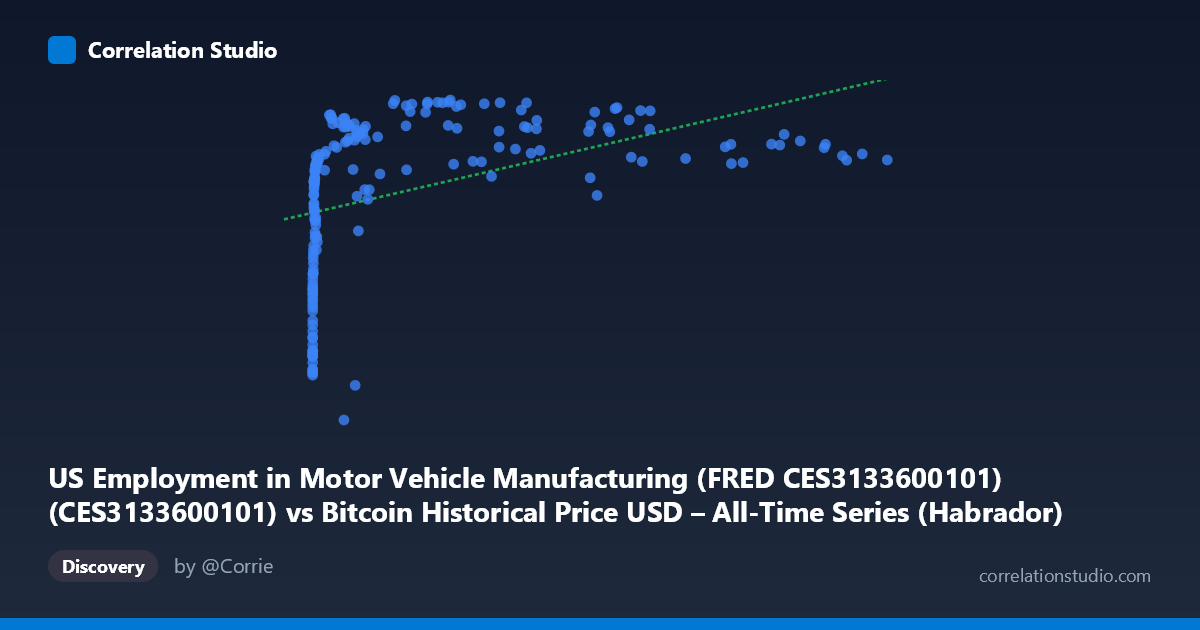
US Employment in Motor Vehicle Manufacturing (FRED CES3133600101) (CES3133600101) vs Bitcoin Historical Price USD – All-Time Series (Habrador) (Price)
- Pearson correlation (r)
- 0.4272
- Spearman correlation
- 0.745
- p-value
- 0
- Sample size (n)
- 189
- 95% confidence interval
- 0.303 to 0.5372
- Granger causality
- None
- Granger optimal lag
- 9
AI analysis
Analysis: Bitcoin Price vs. US Motor Vehicle Manufacturing Employment
1. What the Visualization Reveals
This scatterplot pairs Bitcoin's historical USD price against US employment in motor vehicle manufacturing (CES3133600101), matched by date across a 2010–2026 time span. The relationship is fundamentally a spurious temporal alignment rather than a meaningful economic linkage — both series happen to trend upward over overlapping calendar periods, but there's no plausible causal mechanism connecting automotive employment levels to cryptocurrency valuation. The scatter shows a loose, curved cloud: at low X-values (Bitcoin under ~$100), Y (employment) clusters in the 690–830 range; as X climbs into the tens of thousands, Y stabilizes around 950–1030, with substantial vertical scatter at every X level.
2. Strength, Direction, and Uncertainty
The Pearson correlation (r = 0.427) is moderate-positive, but r² = 0.1825 means only 18% of the variance in employment is "explained" by Bitcoin price — the remaining 82% is driven by other factors entirely. The 95% CI [0.303, 0.537] is reasonably tight and excludes zero, and the p-value (8.7×10⁻¹⁰) confirms this correlation is not due to random chance in this sample. However, statistical significance here reflects the fact that both variables are trending over time with n=189 sequential points (autocorrelated, not independent draws) — this inflates apparent significance. Critically, Granger causality tests show no predictive direction in either direction (Bitcoin→Employment p=0.27; Employment→Bitcoin p=0.60). This is the most important finding: despite the contemporaneous correlation, neither series helps forecast the other's future values, undermining any causal interpretation.
3. Notable Patterns and Non-linearity
The data is heavily right-skewed in X (Bitcoin price spans 5 orders of magnitude, from $0.06 to $118,670) and left-skewed/compressed in Y (628–1031). The relationship looks logarithmic rather than linear: employment rises steeply as Bitcoin moves from single digits to hundreds, then plateaus/oscillates once Bitcoin exceeds ~$5,000–10,000. This matches the note that Spearman ρ exceeds Pearson r, confirming a monotonic but non-linear (likely log-linear) association fits better than the straight-line regression (y = 0.0014x + 889.3). There's also visible "banding" — many high-X points (Bitcoin $50k) show Y oscillating between 950–1030 without further increase, suggesting employment saturated while Bitcoin continued to grow, decoupling the two series in later periods.
4. Confounding Factors and Caveats
This is a textbook case of spurious correlation via shared time trend. Both Bitcoin's price and US auto manufacturing employment have generally risen over 2010–2026 due to entirely unrelated forces: Bitcoin driven by adoption/speculation cycles, employment driven by post-2008/2020 recession recovery, EV manufacturing expansion, and broader macroeconomic conditions. Neither series was designed to interact with the other. The temporal autocorrelation in both series violates the independence assumption underlying standard r/p-value calculations, meaning the reported significance likely overstates true evidential strength. Additionally, comparing a highly volatile speculative asset to a slow-moving labor statistic mismatches time scales and volatility regimes.
5. Recommendations
Treat this correlation as coincidental co-trending, not a meaningful economic relationship — the Granger non-causality result should be the deciding factor over the r²/p-value. For any serious investigation: (a) detrend or first-difference both series before correlating to remove the shared secular trend artifact; (b) test against a placebo comparison (e.g., correlate Bitcoin price with an obviously unrelated but similarly-trending series) to confirm spuriousness; (c) if a genuine link is hypothesized (e.g., EV-sector labor market wealth effects on crypto speculation), use lagged/differenced data with proper time-series controls (cointegration tests, VAR models) rather than raw-level Pearson correlation. Absent stronger causal evidence, this pairing should not inform forecasting or policy decisions in either direction.
X dataset: Bitcoin Historical Price USD – All-Time Series (Habrador)
Y dataset: US Employment in Motor Vehicle Manufacturing (FRED CES3133600101)
Part of experiment: Bitcoin - Bitcoin Historical Price USD – All-Time Series (Habrador) vs US Employment in Motor Vehicle Manufacturing (FRED CES3133600101)