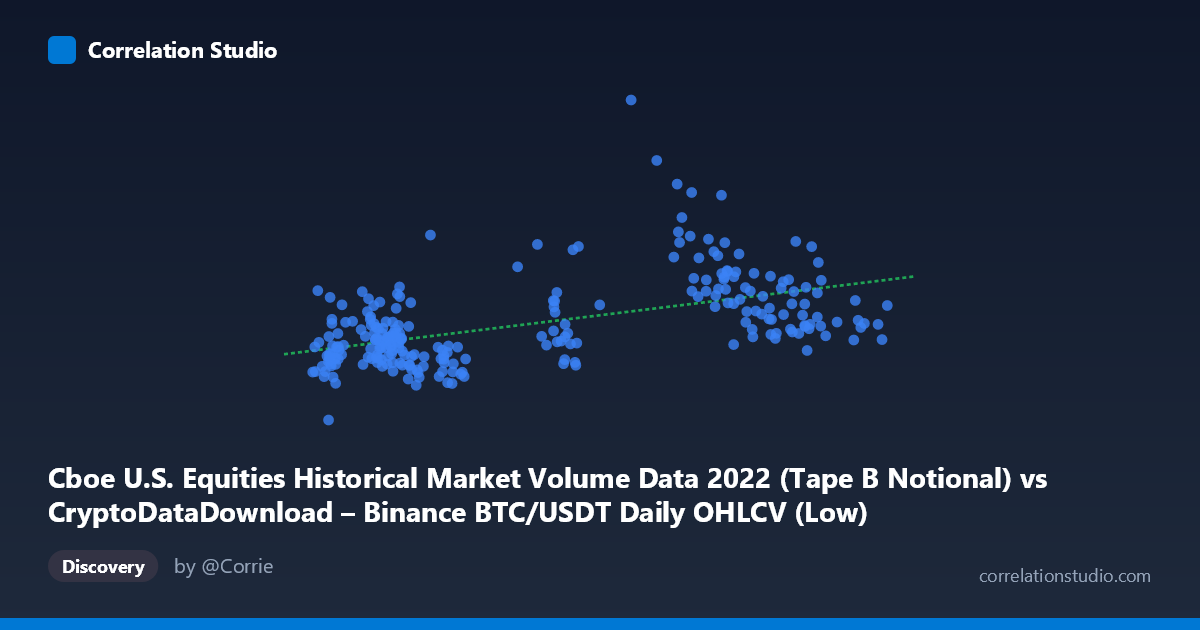
Cboe U.S. Equities Historical Market Volume Data 2022 (Tape B Notional) vs CryptoDataDownload – Binance BTC/USDT Daily OHLCV (Low)
- Pearson correlation (r)
- 0.523
- Spearman correlation
- 0.5079
- p-value
- 0
- Sample size (n)
- 251
- 95% confidence interval
- 0.4269 to 0.6075
- Granger causality
- None
- Granger optimal lag
- 10
AI analysis
Analysis: Cboe Equities Volume vs. BTC/USDT Price (Low)
1. Relationship Overview The scatterplot shows a moderate positive linear relationship between Cboe U.S. equities notional volume and Binance BTC/USDT daily low prices across 2022. As equity market volume increases, Bitcoin's price tends to rise as well, though the relationship is far from deterministic — there is substantial scatter around the regression line (y = 120,460x + 4.058×10⁹), particularly at lower X values where Y shows wide dispersion (roughly 4.2B to 8.8B) despite similar X readings around 16,000–20,000.
2. Strength, Direction, and Uncertainty With r = 0.523 and r² = 0.274, only about 27% of the variance in BTC price is statistically associated with equity volume — meaning nearly three-quarters of BTC price movement is driven by other factors. The correlation is positive and statistically significant (p < 0.001), with a 95% CI of [0.427, 0.608] indicating the true population correlation is very likely moderate, not weak or strong. Critically, the Granger causality tests show no significant predictive direction in either direction (X→Y: p = 0.385; Y→X: p = 0.299) at the optimal lag of 10 periods. This means neither variable helps forecast the other over time — the contemporaneous correlation likely reflects a shared external driver (e.g., macro market conditions, risk sentiment) rather than one market leading the other.
3. Notable Patterns and Outliers The data shows a clear two-cluster structure rather than a smooth linear trend: - Low-X cluster (X ≈ 15,000–23,000): Y values are tightly packed in the 4.2B–8.8B range, suggesting a baseline volume regime with modest BTC price variation. - High-X cluster (X ≈ 35,000–43,000): Y values are more elevated and dispersed (6.8B–14.8B), including several high-leverage points (e.g., 35,440 → 14.83B; 37,867 → 14.24B) that appear to pull the regression slope upward. - A gap in X values between ~23,000 and ~35,000 is visible, suggesting the data may cluster around two distinct market regimes (e.g., different volatility periods or quarters in 2022) rather than a continuous relationship. - The high-X, high-Y points could be disproportionately influencing the r² — worth checking via robust regression or leverage diagnostics.
4. Confounding Factors and Caveats This correlation is almost certainly confounded by broader macroeconomic conditions in 2022 (Fed rate hikes, risk-off sentiment, inflation data) that simultaneously affected both traditional equity trading volumes and crypto prices — these are not causally linked markets in any direct mechanical sense. Additionally: - Comparing a volume metric (Cboe) to a price metric (BTC low) is an apples-to-oranges comparison; a volume-to-volume or price-to-price comparison might be more meaningful. - No lag/lead relationship exists per Granger tests, undermining any "equities volume predicts BTC price" narrative. - 251 paired samples from a population of 3,212 (~7.8%) — sampling methodology (every-5th-point pattern) should be checked for representativeness across the full year. - The apparent bimodal X clustering suggests time-of-year effects (e.g., higher equity volume in certain months) that could be an omitted confounding variable (seasonality, options expiration days, macro news events).
5. Suggested Further Investigation - Test for a common third factor (e.g., VIX, DXY, or a macro risk index) that might explain co-movement without direct causality. - Segment the analysis by month/quarter to check if the correlation is driven by a specific period (e.g., a volatile May–November 2022 stretch) rather than holding year-round. - Compare volume-to-volume (Cboe volume vs. BTC volume) instead of volume-to-price for a cleaner economic interpretation. - Consider a rolling-window correlation to see if the relationship strengthens/weakens over time rather than assuming stationarity across all 251 points. - Given the null Granger result, avoid using either series as a leading indicator for the other in trading or forecasting models — treat the correlation as coincidental/co-driven rather than predictive.
X dataset: CryptoDataDownload – Binance BTC/USDT Daily OHLCV
Y dataset: Cboe U.S. Equities Historical Market Volume Data 2022
Part of experiment: Bitcoin - CryptoDataDownload – Binance BTC/USDT Daily OHLCV vs Cboe U.S. Equities Historical Market Volume Data 2022