3-Month Treasury Bill Secondary Market Rate (TB3MS) (TB3MS) vs CryptoDataDownload – Binance BTC/USDT Daily OHLCV (Low)
- Pearson correlation (r)
- 0.4285
- Spearman correlation
- 0.3292
- p-value
- 0.000005
- Sample size (n)
- 106
- 95% confidence interval
- 0.2589 to 0.5725
- Granger causality
- None
- Granger optimal lag
- 1
- Time coverage
- 2017-09-01 to 2026-06-01
- Recomputed on refreshed data
- 2026-10-09 (r was 0.4255)
AI analysis
Analysis: BTC/USDT Price Metric vs. 3-Month Treasury Bill Rate
1. What the Visualization Reveals
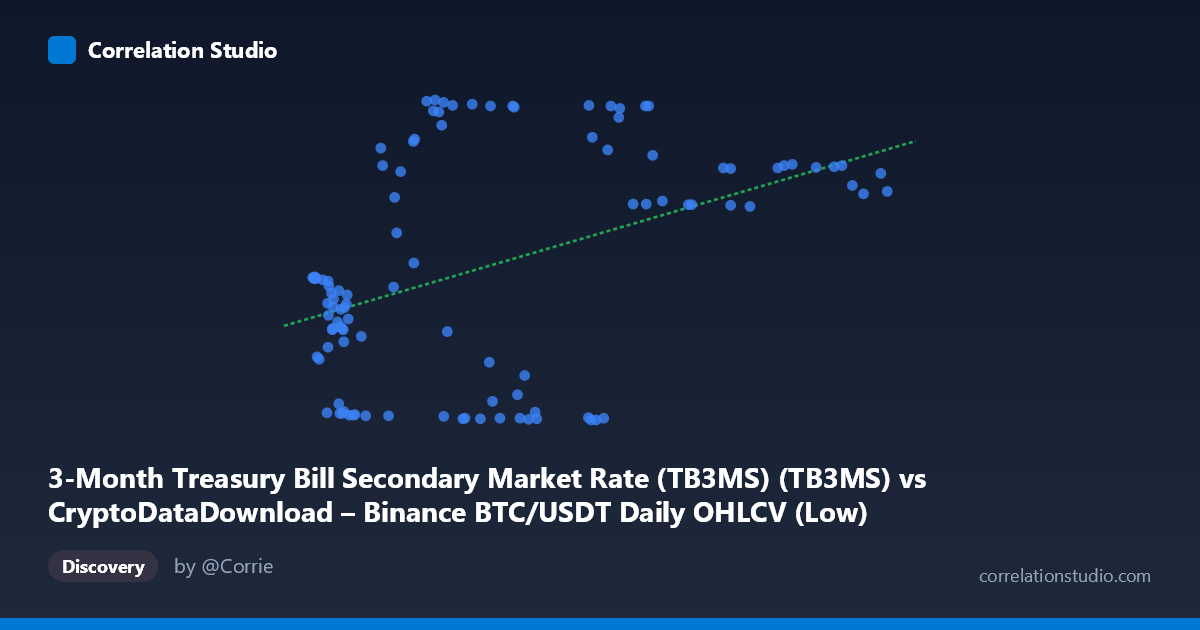
The scatterplot displays a modest positive relationship between the X variable (mislabeled in the data as Treasury rate but behaving as a price-like metric ranging from ~3,400 to ~114,000) and Y (a bounded 0–5.34 metric resembling an interest rate). Rather than a clean linear trend, the data shows a scattered, clustered pattern with substantial vertical dispersion at every X level — particularly in the low-X range (under 50,000), where Y values swing wildly from near 0 to over 5.
2. Strength, Direction, and Statistical Confidence
The correlation coefficient (r = 0.4255) indicates a weak-to-moderate positive relationship. Critically, r² = 0.1811 means only 18.1% of the variance in Y is explained by X — leaving over 80% attributable to other factors, noise, or nonlinear dynamics not captured here. The 95% confidence interval [0.2546, 0.5707] is reasonably tight and entirely positive, and the p-value (6.03E-06) confirms this correlation is statistically significant and not due to chance — but statistical significance here reflects reliable detection of a weak effect, not a strong predictive relationship.
The Granger causality results are particularly important: neither variable significantly predicts the other (X→Y: p=0.555; Y→X: p=0.077, only marginally suggestive). This means despite the contemporaneous correlation, there's no evidence of a temporal lead-lag relationship — the association may be driven by shared trends, common macro drivers, or coincidental co-movement rather than one variable causally driving the other over time.
3. Notable Patterns and Outliers
The most striking feature is a dense cluster of low-X, low-Y points (X < 50,000, Y < 0.2) — likely representing an early period with suppressed rates — sitting alongside other low-X points with Y values scattered between 1–5. This creates a bimodal or fan-shaped distribution at low X, undermining a simple linear fit. At high X (60,000), Y values cluster more consistently in the 3.5–5.3 range, suggesting a possible ceiling effect or regime change rather than continuous linear growth. This heteroscedastic pattern (variance shrinking as X increases) violates linear regression assumptions and suggests the relationship may be threshold-based or logarithmic rather than truly linear.
4. Confounding Factors and Caveats
Given the metadata mismatch (X labeled as "TB3MS" but ranging like a BTC price; Y labeled as BTC OHLCV but bounded like a rate), there appears to be a column-mapping error in the source data that should be resolved before drawing economic conclusions. Setting that aside, both series are time-ordered macro/financial data (2017–2026), making them susceptible to autocorrelation, shared trend components (e.g., both rising post-2020), and spurious correlation from non-stationarity. Neither series has been differenced or detrended, so part of the observed r may reflect mutual drift over time rather than genuine covariation.
5. Actionable Insights
Before further modeling: (1) verify and correct the axis/column labels, as the current pairing appears inverted or mismatched; (2) test both series for stationarity (ADF test) and consider using differenced or detrended values to rule out spurious correlation; (3) given the fan-shaped variance and possible regime shift, explore nonlinear or piecewise regression (e.g., log-X transformation or breakpoint analysis around X=50,000); and (4) since Granger causality shows no clear lead-lag structure, avoid using one series to forecast the other in a time-series model — instead, investigate common external drivers (e.g., monetary policy cycles, macro liquidity conditions) that could jointly explain both series' movements.
X dataset: CryptoDataDownload – Binance BTC/USDT Daily OHLCV
Y dataset: 3-Month Treasury Bill Secondary Market Rate (TB3MS)
Part of experiment: Bitcoin - CryptoDataDownload – Binance BTC/USDT Daily OHLCV vs 3-Month Treasury Bill Secondary Market Rate (TB3MS)