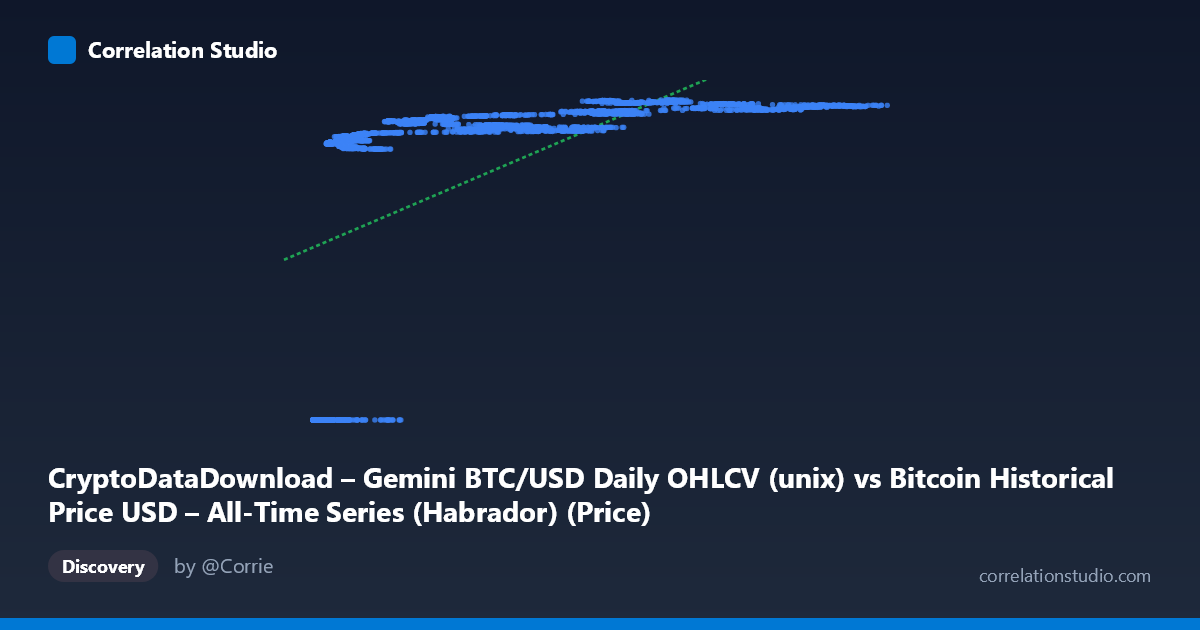
CryptoDataDownload – Gemini BTC/USD Daily OHLCV (unix) vs Bitcoin Historical Price USD – All-Time Series (Habrador) (Price)
- Pearson correlation (r)
- 0.5428
- Spearman correlation
- 0.9363
- p-value
- 0
- Sample size (n)
- 3996
- 95% confidence interval
- 0.5205 to 0.5643
- Granger causality
- None
- Granger optimal lag
- 10
- Time coverage
- 2015-10-08 to 2026-09-15
- Recomputed on refreshed data
- 2026-10-24 (r was 0.5317)
AI analysis
Analysis: Bitcoin Price (X) vs. Timestamp (Y)
What the data actually represents
It's important to first note an unusual structural feature of this dataset: the Y-axis is a Unix timestamp (essentially "time" itself, expressed as milliseconds since epoch), while X is BTC/USD price. This inverts the typical convention — normally we'd plot price against time, not time against price. Functionally, this is a time-series price chart rotated 90 degrees, so the "correlation" being measured is really asking: does knowing Bitcoin's price tell you approximately when in history that observation occurred? Given Bitcoin's well-known long-term upward trajectory across market cycles, some positive association is expected almost by construction.
Strength, direction, and uncertainty
The Pearson correlation (r = 0.532) indicates a moderate positive relationship, with R² = 0.283 meaning only about 28% of the variance in the timestamp is explained by a linear function of price. The 95% CI [0.509, 0.554] is tight thanks to the large sample (n=3,856), and the p-value of ~0 confirms the relationship is not due to chance — but statistical significance here reflects sample size and non-independence of time-series data more than practical predictive strength. Critically, the Granger causality tests show no significant predictive direction in either direction (X→Y p=0.61, Y→X p=0.90). This makes sense given the axis setup: price doesn't "cause" time, and time doesn't linearly "cause" price in a way a fixed-lag linear model captures — Bitcoin's price path is highly non-stationary and regime-dependent, not a steady function of elapsed time.
Patterns, clusters, and non-linearity
The sample points reveal the real story: this is not a linear cloud but a series of stair-stepped clusters corresponding to Bitcoin's boom-bust cycles (2013, 2017, 2021, 2024-25 bull runs interspersed with prolonged bear/consolidation periods). Many low-price points (X < 20,000) span a huge range of timestamps (2015 through 2023), while high-price points (X 90,000) cluster tightly in 2024-2025. This produces a curve that looks logarithmic or exponential rather than linear — consistent with the note that Spearman ρ exceeds Pearson r, confirming a monotonic but curved (likely exponential price growth / log-time) relationship rather than a straight line. A linear model systematically underfits the flat "bear market plateaus" and overfits the steep recent runup.
Confounders and caveats
The core caveat is that this isn't really measuring a causal or even meaningfully correlative economic relationship — it's an artifact of Bitcoin's historical price trend (long-term appreciation with high volatility) combined with an unconventional axis choice. Autocorrelation in time-series price data violates the independence assumptions behind p-values and confidence intervals, so the apparent statistical certainty (p≈0) is overstated in practical terms. Additionally, market regime shifts (halvings, macro liquidity cycles, exchange-specific quirks in the Gemini feed) are confounds not captured by a simple X-Y fit.
Recommendations
Re-orient the analysis with time (or log-time) as the independent variable and price (or log-price) as dependent, which is the natural causal direction and will likely produce a much better-fitting model (log-linear or exponential regression, given Bitcoin's historic CAGR pattern). Consider fitting log(Y-time-elapsed) vs log(X-price) or a proper exponential/power curve, and use time-series-appropriate methods (e.g., ARIMA, cycle/halving-based segmentation) rather than cross-sectional correlation, since Granger tests already indicate no useful fixed-lag linear predictive relationship in either raw direction.
X dataset: Bitcoin Historical Price USD – All-Time Series (Habrador)
Y dataset: CryptoDataDownload – Gemini BTC/USD Daily OHLCV
Part of experiment: Bitcoin - Bitcoin Historical Price USD – All-Time Series (Habrador) vs CryptoDataDownload – Gemini BTC/USD Daily OHLCV