Crude Oil Prices: West Texas Intermediate (WTI) - Cushing, Oklahoma (MCOILWTICO) | FRED | St. Louis Fed (MCOILWTICO) vs CryptoDataDownload – Binance BTC/USDT Daily OHLCV (Unix)
- Pearson correlation (r)
- 0.4496
- Spearman correlation
- 0.5188
- p-value
- 0.000001
- Sample size (n)
- 106
- 95% confidence interval
- 0.2831 to 0.5898
- Granger causality
- None
- Granger optimal lag
- 8
AI analysis
Analysis: WTI Crude Oil Prices vs. Time-Series Values
1. Overview of the Relationship
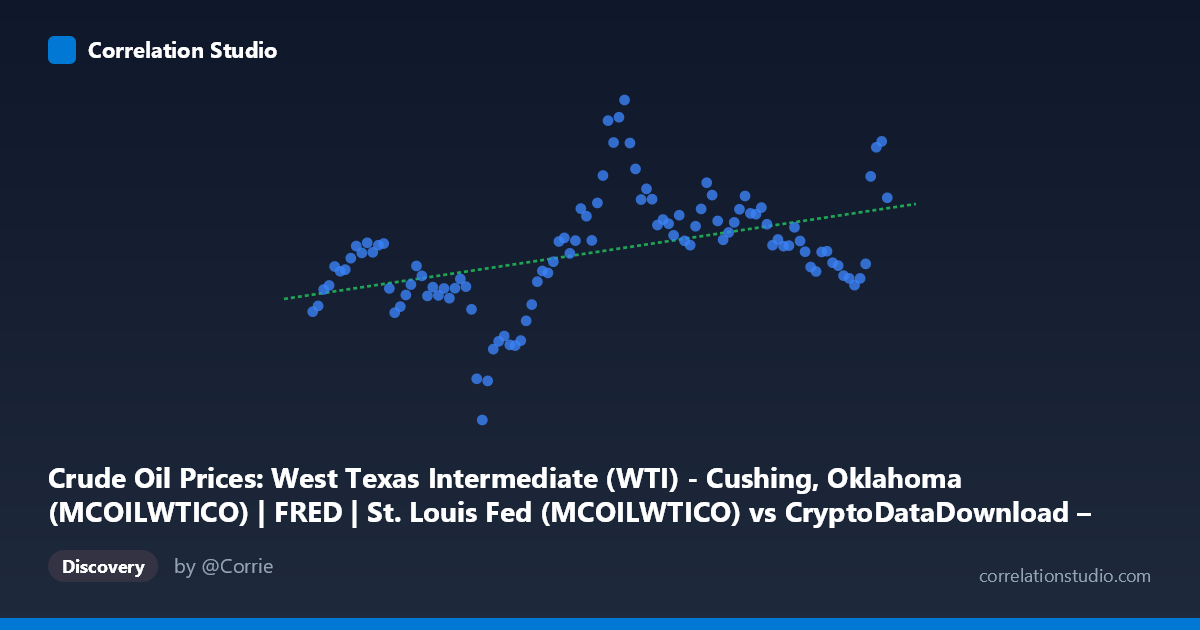
The scatterplot shows a moderate positive association between the two variables across the ~9-year span (2017–2026). As the X variable increases, Y values tend to rise as well, though the relationship is far from tight — points are widely scattered around the implied trend line rather than clustering closely to it. This suggests a real but limited linear relationship, with substantial unexplained variability at every point along the X-axis.
2. Strength, Direction, and Statistical Confidence
The correlation coefficient (r = 0.450) indicates a moderate positive relationship. However, the r² value of 0.2026 is the more practically important figure: it tells us that only ~20% of the variance in Y is explained by X, leaving 80% attributable to other factors, noise, or nonlinear dynamics not captured by this simple linear model. The 95% confidence interval [0.284, 0.590] is reasonably tight and entirely positive, and the p-value (1.29 × 10⁻⁶) is highly significant — so we can be confident a real, non-zero positive correlation exists in the population. That said, statistical significance here reflects the large sample size (n=106) more than practical predictive strength; r² of ~0.20 means this relationship alone would be a weak standalone predictor.
Critically, the Granger causality tests show no significant predictive direction in either direction (X→Y: p=0.071; Y→X: p=0.222, at the optimal 8-period lag). This means neither variable reliably "leads" or forecasts future movements in the other over time — the correlation appears to be more of a contemporaneous/coincidental co-movement (possibly both variables independently trending upward over the sample period) rather than one causally driving the other in a temporally predictive sense.
3. Notable Patterns and Outliers
Several features stand out in the data: there's a visible low-value cluster around early-to-mid 2020 (Y values in the 16–40 range, e.g., 16.55, 38.31, 39.63, 39.40, 40.71) — consistent with the COVID-19 crash period — followed by a broad recovery and higher plateau in subsequent years (Y often in the 60–100+ range). There's also a notable spike near X≈1,651,363,200,000 (Y=109.55), an outlier on the high end. The relationship doesn't look strictly linear; it more resembles a regime shift (low pre-2021, higher and more volatile post-2021) than a smooth continuous trend, which would inflate the linear r² without reflecting a true proportional relationship.
4. Confounding Factors and Caveats
Since X is a timestamp derived from BTC/USDT OHLCV data and Y is WTI crude oil pricing, this is fundamentally a time-series correlation, not a direct economic mechanism linking Bitcoin trading activity to oil prices. Both series likely reflect shared macro drivers — inflation, USD strength/weakness, global liquidity/monetary policy, risk-on/risk-off sentiment, and the 2020 pandemic shock — rather than a direct causal link between crypto markets and oil markets. This is a classic case where spurious correlation via a common trending third factor (time/macro cycle) is plausible. Additionally, using raw timestamps as "X" conflates calendar time with any actual causal variable, further muddying interpretation.
5. Suggestions for Further Investigation
To clarify whether there's genuine economic linkage, consider: (a) testing correlation on detrended or differenced series (e.g., returns/changes rather than levels) to remove the shared upward drift and see if a relationship persists; (b) explicitly controlling for known common macro factors (USD index, inflation expectations, equity market indices) via multivariate regression; (c) segmenting the analysis by regime (pre/post-2020 crash) to check whether the correlation is stable or driven entirely by the pandemic-era co-movement; and (d) given the non-significant Granger results, avoid using one series to forecast the other in a trading or planning context — the data doesn't support a reliable lead-lag relationship despite the overall positive correlation.
X dataset: CryptoDataDownload – Binance BTC/USDT Daily OHLCV
Y dataset: Crude Oil Prices: West Texas Intermediate (WTI) - Cushing, Oklahoma (MCOILWTICO) | FRED | St. Louis Fed
Part of experiment: Bitcoin - CryptoDataDownload – Binance BTC/USDT Daily OHLCV vs Crude Oil Prices: West Texas Intermediate (WTI) - Cushing, Oklahoma (MCOILWTICO) | FRED | St. Louis Fed