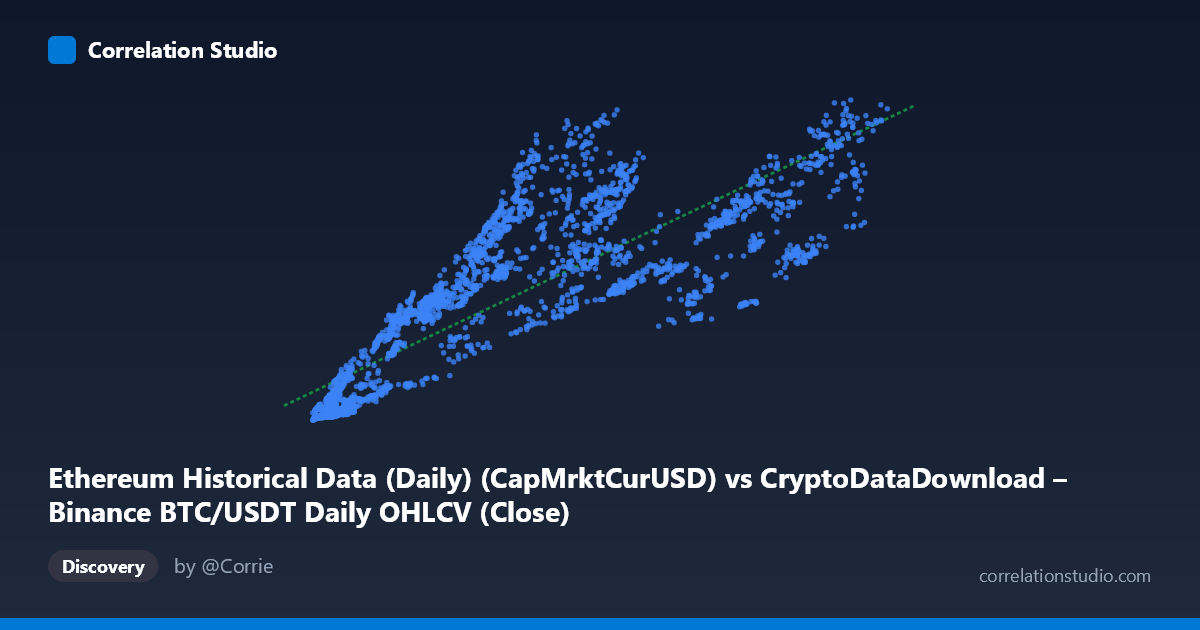
Ethereum Historical Data (Daily) (CapMrktCurUSD) vs CryptoDataDownload – Binance BTC/USDT Daily OHLCV (Close)
- Pearson correlation (r)
- 0.848
- Spearman correlation
- 0.913
- p-value
- 0
- Sample size (n)
- 3191
- 95% confidence interval
- 0.8379 to 0.8575
- Granger causality
- None
- Granger optimal lag
- 10
AI analysis
Analysis: Ethereum Market Cap vs. BTC/USDT Close Price
Note on labeling: The axis metadata appears swapped or mismatched (X is labeled as Ethereum market cap, Y as BTC/USDT close), but the actual values (X: ~3K-125K; Y: ~8.6B-585B) strongly suggest X is BTC price and Y is Ethereum market cap. This analysis proceeds on that basis, as it aligns with the data ranges and typical crypto relationships.
1. Relationship Overview The scatterplot depicts a strong positive association between Bitcoin's price and Ethereum's market capitalization. As BTC price rises from roughly $3,000 to $125,000, ETH market cap climbs from single-digit billions to over $580 billion. The linear fit (y = 4.05M·x + 46B) captures the broad upward trend, though the relationship shows visible curvature and heteroscedasticity rather than a perfectly uniform linear climb.
2. Strength, Direction, and Statistical Confidence The correlation coefficient (r = 0.848) indicates a strong positive linear relationship, with R² = 0.719 meaning 72% of the variance in ETH market cap is statistically explained by BTC price — a substantial but incomplete share, leaving nearly 28% driven by other factors (ETH-specific fundamentals, market sentiment, etc.). The tight 95% CI [0.838, 0.858] and p-value of 0 confirm this correlation is highly reliable and not a sampling artifact, given the large N (3,191). However, the Granger causality tests are critical: neither direction shows significant predictive power (BTC→ETH: p=0.72; ETH→BTC: p=0.77). This means despite the strong contemporaneous correlation, neither variable's past values help forecast the other's future values — the relationship is likely driven by shared external factors (e.g., overall crypto market cycles, macro liquidity conditions) rather than one asset causally leading the other.
3. Patterns and Non-Linear Features Several notable features emerge: - Fanning/heteroscedasticity: Variance in ETH market cap increases substantially at higher BTC prices, suggesting the relationship isn't strictly linear — a power-law or log-linear model might fit better. - Clustering at low X values: Many points cluster in the BTC $3K-$15K range with ETH market caps ranging widely ($14B-$132B), indicating higher relative noise during early market periods. - Potential regime clusters: Points like (13474.99, 132B) appear as outliers relative to neighboring low-BTC-price points, hinting at distinct market cycles (e.g., 2017 ICO boom vs. later periods) where ETH decoupled temporarily from BTC.
4. Confounding Factors and Caveats This is time-series cross-sectional data spanning 2017-2026, meaning both variables are influenced by common macro drivers: overall crypto market sentiment, Bitcoin halving cycles, regulatory news, and broad risk-on/risk-off capital flows. The correlation likely reflects shared market beta rather than a direct mechanical link. Additionally, using raw price/market-cap levels (rather than returns) risks spurious correlation from co-trending non-stationary series — both variables trend upward over time due to overall crypto market growth, inflating r without necessarily reflecting genuine interdependence. The lack of Granger causality reinforces this concern.
5. Recommendations for Further Investigation - Test with returns/log-differences instead of levels to check if the correlation persists after removing trend/co-integration effects — this would better isolate genuine short-term co-movement. - Segment by market regime (bull vs. bear cycles) to see if the BTC-ETH relationship strengthens or weakens during specific periods. - Explore log-log transformation given the apparent non-linearity and variance fanning at higher price levels. - Introduce a third variable (e.g., total crypto market cap, DXY, or Fed funds rate) to test whether BTC and ETH are both responding to a common macro factor, which would explain the correlation without direct causality.
X dataset: CryptoDataDownload – Binance BTC/USDT Daily OHLCV
Y dataset: Ethereum Historical Data (Daily)
Part of experiment: Bitcoin - CryptoDataDownload – Binance BTC/USDT Daily OHLCV vs Ethereum Historical Data (Daily)