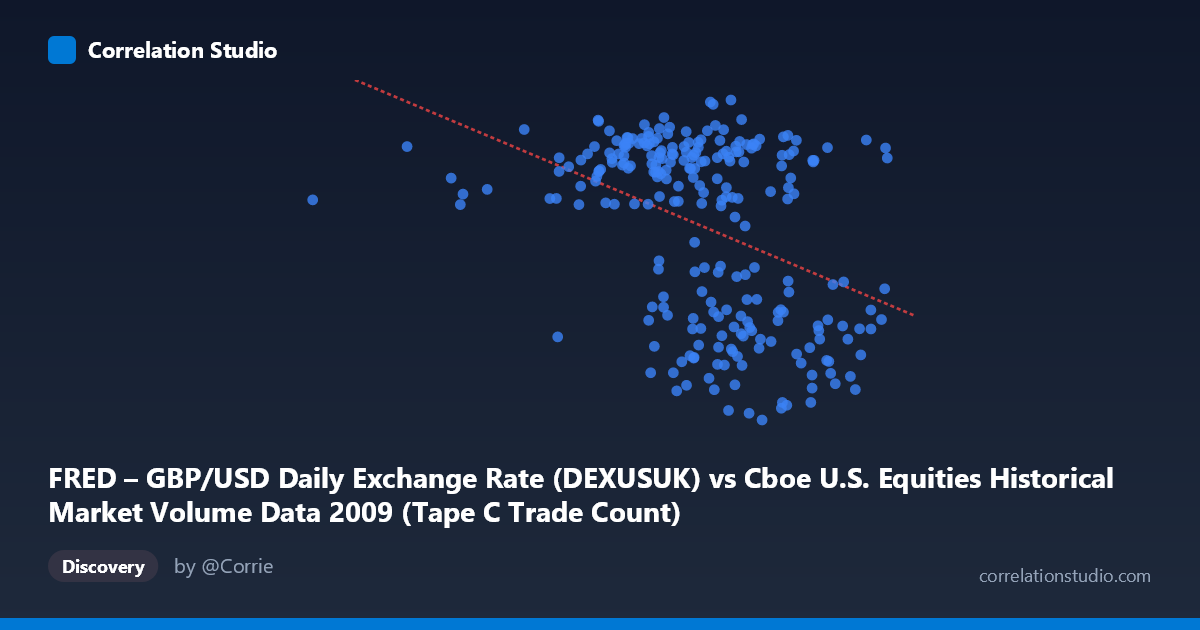
FRED – GBP/USD Daily Exchange Rate (DEXUSUK) vs Cboe U.S. Equities Historical Market Volume Data 2009 (Tape C Trade Count)
- Pearson correlation (r)
- -0.4021
- Spearman correlation
- -0.3732
- p-value
- 0
- Sample size (n)
- 250
- 95% confidence interval
- -0.5012 to -0.2926
- Granger causality
- None
- Granger optimal lag
- 1
AI analysis
Analysis: GBP/USD Exchange Rate vs. Cboe Tape C Trade Count (2009)
Relationship Overview The scatterplot reveals a negative relationship between the GBP/USD daily exchange rate (X-axis) and Cboe Tape C trade count (Y-axis) across 2009 trading days. As the exchange rate increases — meaning the British pound strengthens relative to the dollar — trade counts tend to decrease modestly. The linear regression equation (y = -3.789E-07x + 1.807) reflects this inverse slope, though the relatively shallow gradient and visible scatter around the trend line signal that the relationship is far from deterministic. Visually, the data cloud tilts downward from left to right, but with considerable dispersion, indicating that many other forces are simultaneously shaping trade activity.
Correlation Strength and Statistical Significance The Pearson correlation of r = -0.40 indicates a moderate negative association, but the explanatory power is limited: r² = 0.162, meaning only about 16.2% of the variance in Tape C trade counts is attributable to variation in the GBP/USD rate. The remaining ~84% is driven by factors outside this model. The 95% confidence interval of [-0.50, -0.29] is entirely negative, providing reasonable assurance that the direction of the relationship is not a statistical artifact, and the p-value of 3.93E-11 confirms the correlation is highly statistically significant given n = 250 paired observations. However, statistical significance here is partly a function of sample size — practical significance remains modest. Critically, Granger causality tests find no significant temporal predictive direction in either direction (X→Y: F = 1.32, p = 0.25; Y→X: F = 0.57, p = 0.45), meaning neither variable reliably predicts the other's future values at a one-period lag. This rules out a straightforward leading-indicator relationship.
Notable Patterns, Clusters, and Outliers Several features stand out on the chart. The bulk of observations cluster in the X range of roughly 550,000–800,000 with Y values between 1.40 and 1.70, forming a moderately dense central cloud. There is a visible outlier at the far left around X ≈ 185,887 (Y ≈ 1.59), which sits far removed from the main cluster — likely an anomalous low-volume or data-integrity day worth flagging. At higher exchange rate values (above ~800,000), trade counts tend to fall below 1.50, reinforcing the negative trend. Some heteroscedasticity is apparent: variance in Y appears somewhat wider in the mid-range of X and narrower at the extremes, which could subtly violate linear regression assumptions and warrants testing. No strong non-linear curvature is obvious, but the scatter is wide enough that a more flexible model might reveal nuanced structure.
Confounding Factors and Interpretive Caveats Interpreting this correlation causally requires significant caution. 2009 was an extraordinary year — encompassing the tail of the global financial crisis, massive equity market volatility, and unusual currency dynamics as sterling weakened sharply. Both variables were likely being simultaneously driven by macroeconomic stress, risk-off sentiment, and central bank interventions, making it highly plausible that a common third factor (e.g., systemic risk appetite, VIX levels, Federal Reserve or Bank of England policy) is responsible for the observed correlation rather than any direct link between sterling's value and Cboe trade volumes. Additionally, Tape C specifically covers NYSE Arca-listed securities, so exchange-specific structural changes or listing migrations in 2009 could independently shift trade counts. The X-axis labels (GBP/USD values in the hundreds of thousands) also warrant verification — these may represent scaled or notional values rather than spot rates in standard forex notation.
Actionable Insights and Further Investigation Despite the limitations, several productive next steps emerge. First, investigators should control for known 2009 volatility drivers — including VIX, S&P 500 daily returns, and Fed policy announcements — to test whether the GBP/USD correlation survives in a multivariate model. Second, the lone far-left outlier (~185,887) should be examined for data quality issues or treated as a regime-change observation. Third, extending the analysis to multiple years would help determine whether the negative relationship is a stable structural feature or a 2009-specific artifact of crisis-era dynamics. Fourth, testing longer Granger lags (beyond 1 period) could reveal delayed predictive relationships not captured at the one-day horizon. Finally, comparing Tape A and Tape B trade counts against the same exchange rate variable would clarify whether this pattern is idiosyncratic to Tape C or a market-wide phenomenon.
X dataset: Cboe U.S. Equities Historical Market Volume Data 2009
Y dataset: FRED – GBP/USD Daily Exchange Rate
Part of experiment: Daily - Cboe U.S. Equities Historical Market Volume Data 2009 vs FRED – GBP/USD Daily Exchange Rate