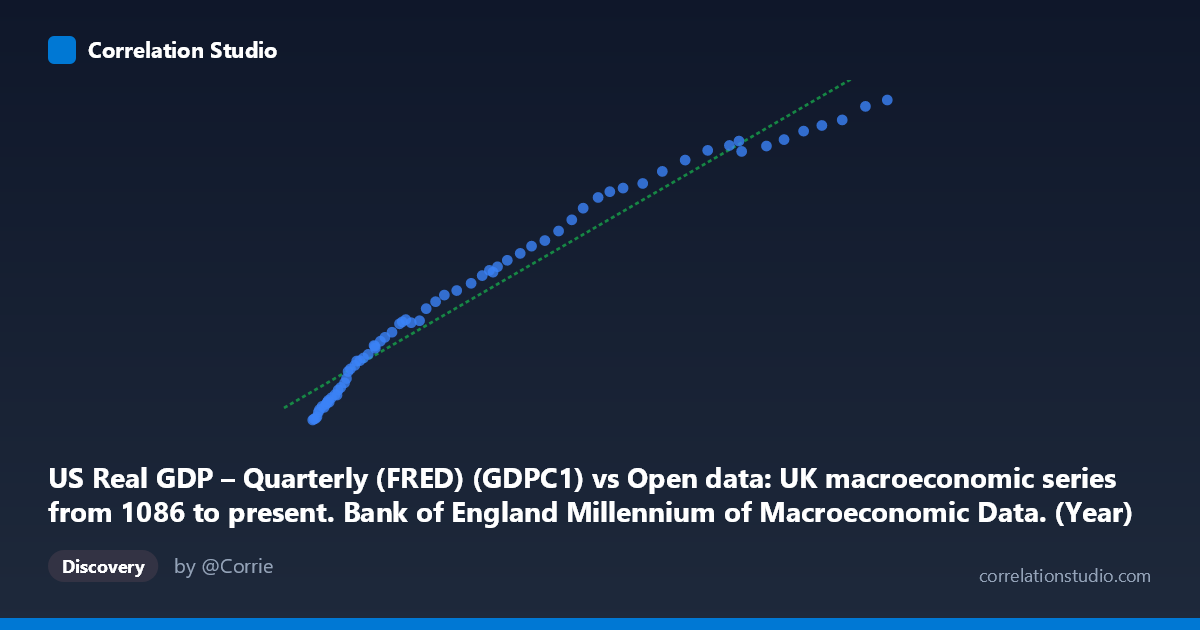
US Real GDP – Quarterly (FRED) (GDPC1) vs Open data: UK macroeconomic series from 1086 to present. Bank of England Millennium of Macroeconomic Data. (Year) (value)
- Pearson correlation (r)
- 0.9811
- Spearman correlation
- 0.9992
- p-value
- 0
- Sample size (n)
- 70
- 95% confidence interval
- 0.9696 to 0.9882
- Granger causality
- None
- Granger optimal lag
- 10
AI analysis
Analysis: US Real GDP vs. UK Macroeconomic Series (1947–2016)
Relationship Overview
The scatterplot reveals a strikingly strong, positive, and broadly linear relationship between US Real GDP (quarterly, FRED) and the Bank of England's UK macroeconomic series variable across the 1947–2016 period. As US GDP rises from roughly $33,000 to $469,000 (in billions of chained 2017 dollars, scaled), the UK variable climbs correspondingly from approximately 2,183 to 19,002. The fitted linear regression — y = 0.0402x + 2,352.72 — traces through the data with remarkable fidelity, suggesting that, at least descriptively, a simple linear model captures the dominant structural pattern in this bivariate relationship. The long time coverage (nearly seven decades) and the smooth, arc-like sweep of the data from lower-left to upper-right is characteristic of two co-evolving macroeconomic aggregates growing together over time.
Correlation Strength and Statistical Significance
The correlation is exceptionally strong: r = 0.9811, with an R² of 0.9625, meaning that approximately 96.3% of the variance in the UK variable is statistically explained by variation in US Real GDP. The 95% confidence interval for r is tight — [0.9696, 0.9882] — confirming that this is not a fragile result sensitive to sampling variation; even the lower bound represents an extraordinarily strong association. The p-value of effectively zero (p ≈ 0) across n = 70 paired observations from a population of N = 317 leaves no doubt about statistical significance. However, the Granger causality results complicate any causal narrative: neither direction of temporal predictability is statistically significant (X→Y: F = 1.544, p = 0.161; Y→X: F = 1.746, p = 0.105), even at an optimal lag of 10 periods. This means that, despite the overwhelming correlation, neither series demonstrably predicts the other in a time-lagged sense — a crucial caveat for any causal interpretation.
Patterns, Clusters, and Notable Features
The data points form a remarkably coherent arc with relatively little scatter around the regression line across the full range, which is itself notable given the span of economic history involved. The lower-left cluster — dominated by observations from the late 1940s through 1960s where US GDP and the UK variable are both at lower absolute levels — is dense and tightly grouped, suggesting less variance in both series during earlier decades. As values increase toward the upper-right (representing more recent decades, particularly post-1990), the points become more spread out and the scatter around the regression line appears slightly wider, hinting at modest heteroscedasticity: variance in the UK variable grows with the level of US GDP. A few upper-range observations (e.g., the point near 468,775 / 19,002 and those clustered between 390,000–435,000 on the X-axis) sit very close to the regression line, suggesting the linear model holds even at the extremes. No dramatic outliers are apparent, which itself is a noteworthy feature of two long-run aggregate growth series.
Confounding Factors and Interpretive Caveats
The most significant caveat is that this correlation almost certainly reflects shared trending behavior over time rather than a direct structural economic link between the two variables. Both US Real GDP and any long-run UK macroeconomic aggregate (nominal GDP, money supply, wages, debt levels, etc.) will tend to grow over decades due to population growth, inflation, technological progress, and compounding — producing a spurious or at least inflated correlation that has little to do with one series causing the other. This is a classic non-stationarity / common trend problem: two independently trending series will appear highly correlated even if they are economically unrelated. The Granger non-causality finding is consistent with this interpretation — the correlation is structural and contemporaneous, not dynamically predictive. Additionally, the identity of the specific UK Bank of England variable is ambiguous from the metadata, making economic interpretation speculative. Currency conversion, differing price deflators, and structural breaks (e.g., Bretton Woods collapse in 1971, the 2008 financial crisis) may also influence the relationship in ways not visible in a simple bivariate plot.
Actionable Insights and Further Investigation
Given the spurious trend concern, the most important next step would be to difference or detrend both series (e.g., compute year-on-year growth rates) before re-examining the correlation — if the relationship survives in growth-rate space, it would be far more economically meaningful. Researchers should also identify the specific UK variable (e.g., UK nominal GDP, CPI, M2) to contextualize the economic mechanism being hypothesized. A cointegration test (e.g., Engle-Granger or Johansen) would be more appropriate than Granger causality for assessing whether a long-run equilibrium relationship exists between two integrated series. Extending the Granger analysis with shorter, more theoretically motivated lags (e.g., 1–4 quarters rather than 10) and controlling for global common factors — such as world trade volumes or global interest rates — would help disentangle US-specific influence from shared global economic cycles. Finally, structural break testing around events like the 1971 dollar shock, 1979–1981 recessions, or 2008 financial crisis could reveal whether the relationship is stable across regimes or masks distinct sub-period dynamics.
X dataset: Open data: UK macroeconomic series from 1086 to present. Bank of England Millennium of Macroeconomic Data. (Year)
Y dataset: US Real GDP – Quarterly (FRED)
Part of experiment: Yearly - Open data: UK macroeconomic series from 1086 to present. Bank of England Millennium of Macroeconomic Data. (Year) vs US Real GDP – Quarterly (FRED)