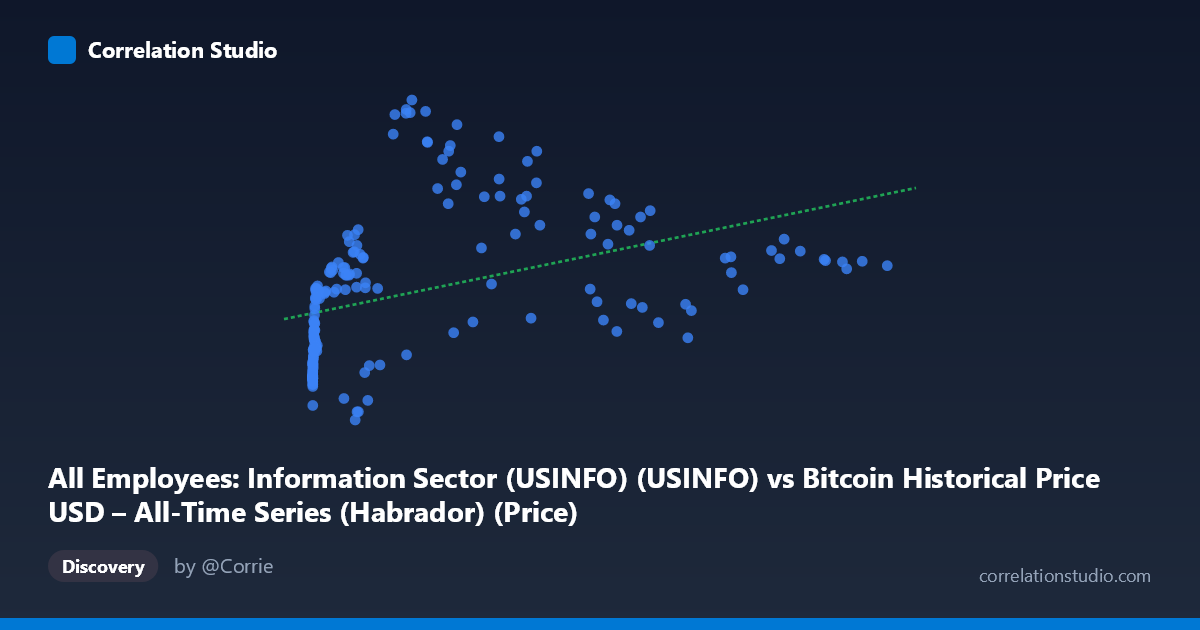
All Employees: Information Sector (USINFO) (USINFO) vs Bitcoin Historical Price USD – All-Time Series (Habrador) (Price)
- Pearson correlation (r)
- 0.4499
- Spearman correlation
- 0.7583
- p-value
- 0
- Sample size (n)
- 189
- 95% confidence interval
- 0.3283 to 0.5569
- Granger causality
- None
- Granger optimal lag
- 10
AI analysis
Analysis: Bitcoin Price vs. Information Sector Employment
1. Relationship Overview
The scatterplot shows a moderate positive association between Bitcoin's historical USD price (X-axis) and U.S. Information Sector employment (Y-axis, USINFO). As Bitcoin's price climbs from near-zero into the tens of thousands of dollars, information-sector employment trends upward from roughly 2,670 to a range clustering around 2,800–3,100. However, the relationship is far from a clean linear trend — it appears more like a compressed, saturating curve, with employment gains flattening even as Bitcoin prices continue to escalate dramatically (note the extreme X-axis range spanning 5 orders of magnitude, from $0.06 to $118,670).
2. Strength, Direction, and Uncertainty
The Pearson correlation (r = 0.45) is moderate, with r² indicating that only 20.2% of the variance in information-sector employment is explained by Bitcoin price — leaving nearly 80% attributable to other factors. The 95% CI [0.33, 0.56] is reasonably tight and excludes zero, and the p-value (8.29E-11) confirms this correlation is highly statistically significant — but statistical significance here reflects a real pattern in the data, not necessarily a meaningful causal or predictive relationship. Critically, the Granger causality tests show no significant predictive direction in either direction (Bitcoin→Employment p=0.63; Employment→Bitcoin p=0.83). This strongly suggests the correlation is not driven by one variable temporally leading the other, but more likely reflects both series independently trending upward over the same multi-year period (a classic case of correlated trends rather than causal linkage).
3. Notable Patterns and Non-linearity
The data hints at non-linearity: at low Bitcoin prices (<$1,000), employment values cluster tightly in the 2,670–2,820 range with low variance. As Bitcoin prices rise past $20,000, Y-values spread more widely (2,770–3,100) and the relationship appears to plateau or even show mild non-monotonicity (e.g., prices near $45,000 and $68,000 show dips to ~2,770–2,785 alongside neighboring points near 3,000+). This is consistent with the note that Spearman ρ exceeds Pearson r — a monotonic but non-linear (possibly logarithmic) relationship fits better than a straight line, which makes sense given Bitcoin's price is inherently exponential/log-distributed while employment grows arithmetically.
4. Confounding Factors and Caveats
This is a textbook case of spurious correlation via shared time trend. Both series span 2010–2026, a period during which Bitcoin experienced multiple boom-bust cycles while U.S. information-sector employment grew steadily due to secular digitization, cloud computing, and tech-sector expansion — largely independent of crypto markets. Macroeconomic drivers (low interest rates, tech investment cycles, COVID-era hiring/layoffs) likely influence both variables simultaneously without either causing the other. Additionally, X's extreme right-skew (mean $20,533 vs. median far lower, stdev $29,894) means a few high-price observations could disproportionately influence the linear fit.
5. Recommendations
Given the lack of Granger causality and modest r², this correlation should not be used for predictive or causal claims. Suggested next steps: (a) detrend both series (e.g., first-difference or year-over-year % change) and re-test correlation/causality to remove the shared-trend artifact; (b) fit a log-transformed model on X given Bitcoin's exponential nature; (c) introduce control variables like overall GDP, tech-sector investment, or S&P 500 performance to test whether a third factor explains both trends; (d) consider narrower sub-periods (e.g., only 2017–2020) to see if the relationship holds outside of the full-sample trend.
X dataset: Bitcoin Historical Price USD – All-Time Series (Habrador)
Y dataset: All Employees: Information Sector (USINFO)
Part of experiment: Bitcoin - Bitcoin Historical Price USD – All-Time Series (Habrador) vs All Employees: Information Sector (USINFO)