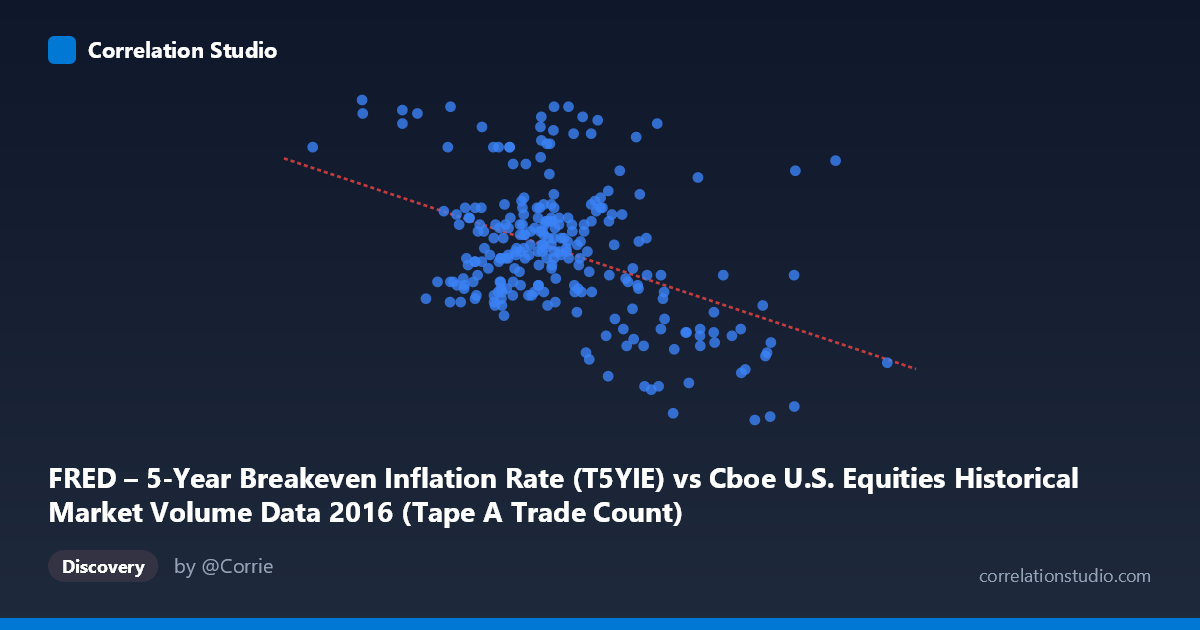
FRED – 5-Year Breakeven Inflation Rate (T5YIE) vs Cboe U.S. Equities Historical Market Volume Data 2016 (Tape A Trade Count)
- Pearson correlation (r)
- -0.4423
- Spearman correlation
- -0.292
- p-value
- 0
- Sample size (n)
- 250
- 95% confidence interval
- -0.5369 to -0.3367
- Granger causality
- Y → X
- Granger optimal lag
- 1
AI analysis
Scatterplot Analysis: 5-Year Breakeven Inflation Rate vs. Cboe Equity Trade Count (2016)
Relationship Overview
The scatterplot reveals a moderate negative relationship between Cboe U.S. equity market trade counts (X-axis) and the 5-year breakeven inflation rate (Y-axis) across 2016. As daily trade volume/count increases, the forward-looking inflation expectation tends to decline, and vice versa. The linear regression equation (y = −2.91×10⁻⁷x + 1.835) captures this downward slope, though the scatter around the regression line is visually substantial, indicating the relationship is real but far from deterministic. The data clusters primarily between roughly 900,000–1,800,000 on the X-axis and 1.20–1.75 on the Y-axis, with the bulk of observations forming a diffuse, elongated cloud tilting downward from left to right.
Correlation Strength, Direction, and Causality
The Pearson correlation of r = −0.44 confirms a statistically significant moderate negative association, with the 95% confidence interval of [−0.54, −0.34] indicating meaningful precision given the sample size of 250. Critically, r² = 0.196, meaning only about 19.6% of the variance in the breakeven inflation rate is explained by trade count — the remaining ~80% is attributable to other forces entirely. The p-value of 2.13×10⁻¹³ makes random chance an implausible explanation, but statistical significance here is partly a function of the large underlying population (N = 3,622). The Granger causality results are particularly informative: Y (inflation breakeven rate) Granger-causes X (trade count) unidirectionally at lag-1 (F = 5.82, p = 0.017), while the reverse direction fails to reach significance (F = 0.81, p = 0.370). This suggests that changes in inflation expectations temporally precede changes in equity market activity, not the other way around — a directionally intuitive finding given that inflation outlook shapes investor behavior.
Patterns, Clusters, and Outliers
Several features stand out in the sample data. There is a visible high-volume, low-inflation cluster around X 1,700,000, where inflation readings consistently fall below 1.30 (e.g., points near 1,693,000/1.02 and 1,860,000/1.20), reinforcing the negative trend. Conversely, moderate trade counts near 1,100,000–1,400,000 show the widest vertical spread (inflation ranging from ~1.24 to 1.86), suggesting high variability in inflation expectations at mid-range activity levels. The point at approximately (2,321,280, 1.70) appears as a potential outlier — unusually high trade count yet elevated inflation — and could represent a specific macro event day. Similarly, (1,362,346, 1.86) stands out as an extreme high-inflation reading. These outliers warrant individual investigation as they may disproportionately influence the regression line.
Confounding Factors and Interpretive Caveats
The 2016 time period carries significant structural confounders. The U.S. presidential election (November 2016) triggered a sharp "reflation trade," simultaneously spiking both inflation expectations and trading volume in ways that could distort the overall annual relationship. Additionally, the axes appear swapped in the dataset metadata — the X-axis label references FRED breakeven inflation while the Y-axis references trade count, yet the regression and sample values suggest the opposite mapping is in effect; this labeling inconsistency should be verified before drawing firm conclusions. More broadly, both variables are driven by common macro forces — Federal Reserve policy shifts, oil price volatility, and risk sentiment cycles — making it difficult to isolate a direct channel between them. The Granger causality result, while suggestive, only captures linear temporal precedence at a one-period lag and does not establish economic causation.
Actionable Insights and Further Investigation
The finding that inflation expectations lead equity trading activity is actionable for market microstructure researchers and volatility traders: monitoring TIPS-derived breakeven rates may provide a short-horizon signal for anticipated changes in market participation and liquidity. Practically, portfolio risk managers could track breakeven rate shifts as a leading indicator of equity market volume regimes. For further investigation, it would be valuable to (1) segment the analysis by pre- and post-election periods to test structural stability of the correlation, (2) introduce VIX or Fed Funds futures as control variables to isolate the inflation-volume channel from broader risk-off dynamics, (3) test non-linear specifications (e.g., piecewise regression) given the apparent variance heterogeneity at mid-range X values, and (4) extend the Granger analysis to longer lags to assess whether the predictive relationship persists beyond one trading day.
X dataset: Cboe U.S. Equities Historical Market Volume Data 2016
Y dataset: FRED – 5-Year Breakeven Inflation Rate
Part of experiment: Daily - Cboe U.S. Equities Historical Market Volume Data 2016 vs FRED – 5-Year Breakeven Inflation Rate