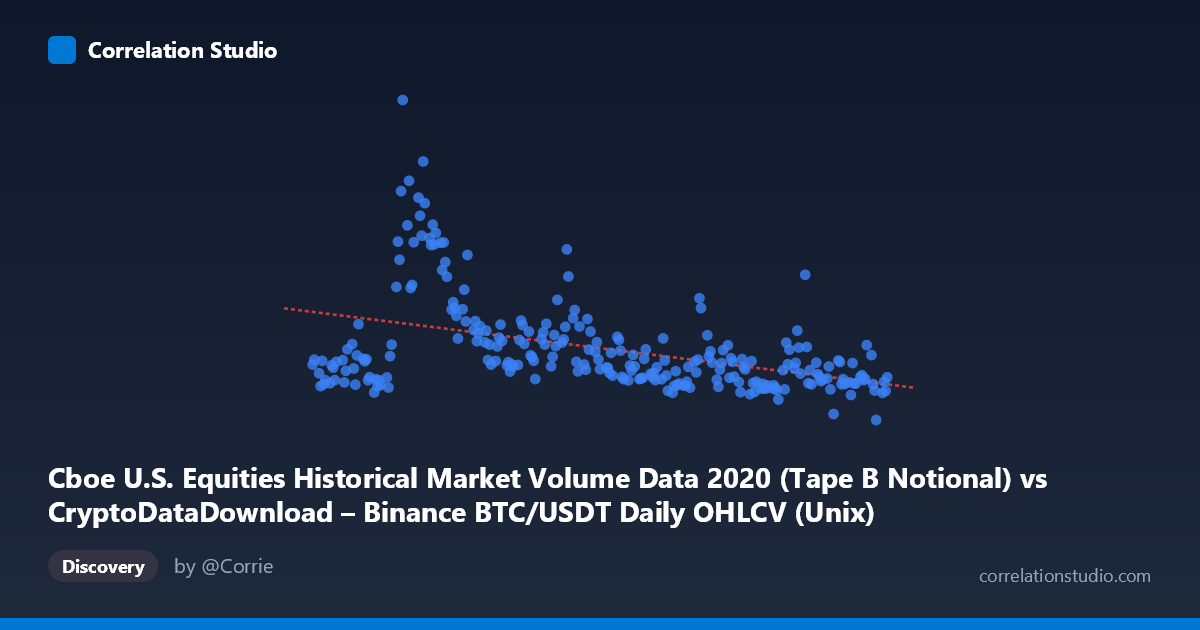
Cboe U.S. Equities Historical Market Volume Data 2020 (Tape B Notional) vs CryptoDataDownload – Binance BTC/USDT Daily OHLCV (Unix)
- Pearson correlation (r)
- -0.4372
- Spearman correlation
- -0.4526
- p-value
- 0
- Sample size (n)
- 253
- 95% confidence interval
- -0.5318 to -0.3317
- Granger causality
- None
- Granger optimal lag
- 10
- Time coverage
- 2020-01-02 to 2020-12-31
AI analysis
Analysis: BTC/USDT Volume vs. Cboe U.S. Equities Notional Volume (2020)
1. Relationship Overview
The scatterplot depicts a moderate negative relationship between Binance BTC/USDT trading volume (X) and Cboe U.S. equities notional volume (Y) across 253 daily observations in 2020. As Bitcoin trading volume increases, equities market volume tends to decrease modestly — though the relationship is far from tight or deterministic. The data cloud is diffuse rather than tracing a clean line, with substantial vertical scatter at nearly every X value, indicating that X is only one of many factors influencing Y.
2. Strength, Direction, and Predictive Value
The correlation coefficient (r = -0.437) indicates a weak-to-moderate negative linear relationship. Critically, r² = 0.191 means only 19% of the variance in equities volume is explained by BTC volume — leaving over 80% attributable to other factors. The 95% CI [-0.532, -0.332] is reasonably tight and excludes zero, and the p-value (3.12E-13) confirms this negative association is statistically robust and not due to chance, despite the modest sample size (n=253 paired days from a population of 3,212). However, statistical significance here reflects precision, not magnitude — the relationship is real but weak in practical terms. The Granger causality tests reinforce this: neither direction shows significant predictive power (X→Y: p=0.498; Y→X: p=0.381), meaning past values of one series do not meaningfully forecast future values of the other. This strongly suggests the correlation is contemporaneous/coincidental rather than causal — likely both series are responding to a shared external driver (e.g., macro volatility, COVID-19 market stress) rather than one influencing the other over time.
3. Notable Patterns and Outliers
Several high-Y outliers stand out prominently: values like 21.2B, 15.7B, 15.0B, and 13.0B (occurring around late Feb–early April 2020, timestamps ~1582-1584 billion) correspond to the COVID-19 market crash and subsequent volatility spike in March 2020. These extreme equities-volume days coincide with relatively unremarkable-to-moderate BTC volumes, which is consistent with — and likely drives — the negative slope, since the crash caused equities volume to spike while crypto volume didn't move proportionally. Excluding this cluster of pandemic-era outliers, the remaining data (roughly April–December 2020) appears more homogeneously scattered with weaker visual correlation, suggesting the overall negative r may be substantially influenced by this one volatility episode rather than a stable year-round dynamic.
4. Confounding Factors and Caveats
Several caveats limit causal interpretation: - Shared macro shock (COVID-19): The March 2020 crash likely inflates equities volume independent of crypto markets, artificially strengthening the negative correlation through a confound rather than genuine inverse dynamics. - Non-stationarity: Both series likely have time-varying volatility regimes (crash vs. recovery periods) that violate assumptions of simple linear correlation across the full year. - Different market structures: Equities notional volume and crypto trading volume respond to different liquidity, regulatory, and participant bases (institutional vs. retail-crypto), so a structural inverse relationship is not obviously expected. - n=253 vs. N=3,212: Sampling reduces power compared to the full population, and if the sample wasn't randomly drawn (e.g., every-5th-point selection), representativeness should be verified.
5. Suggestions for Further Investigation
- Segment the analysis: Re-run correlation and Granger tests excluding the March 2020 crash period to test whether the negative relationship holds outside this outlier window — this would clarify whether the effect is crash-driven. - Test volatility indices directly: Consider correlating both series against VIX or realized volatility as a common driver, rather than against each other. - Detrend/difference the series: Since Granger causality found no lagged predictive relationship, consider testing first-differenced or log-return versions of both series to remove trend/level effects and re-examine short-term co-movement. - Practical takeaway: Given the lack of Granger causality and modest r², this pairing offers limited value as a forecasting signal for trading or hedging strategies; the correlation is better treated as a historical curiosity of 2020's volatility regime than an exploitable relationship.
X dataset: CryptoDataDownload – Binance BTC/USDT Daily OHLCV
Y dataset: Cboe U.S. Equities Historical Market Volume Data 2020
Part of experiment: Bitcoin - CryptoDataDownload – Binance BTC/USDT Daily OHLCV vs Cboe U.S. Equities Historical Market Volume Data 2020