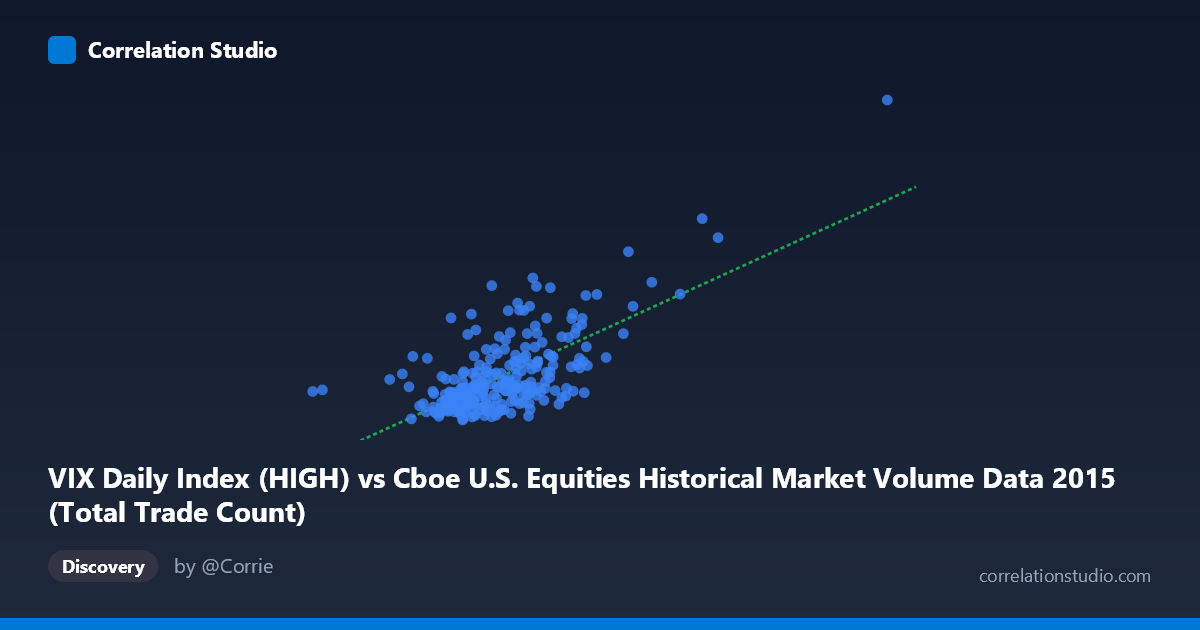
VIX Daily Index (HIGH) vs Cboe U.S. Equities Historical Market Volume Data 2015 (Total Trade Count)
- Pearson correlation (r)
- 0.6844
- Spearman correlation
- 0.5638
- p-value
- 0
- Sample size (n)
- 252
- 95% confidence interval
- 0.6127 to 0.745
- Granger causality
- None
- Granger optimal lag
- 1
- Time coverage
- 2015-01-02 to 2015-12-31
- Recomputed on refreshed data
- 2026-10-09 (r was 0.6844)
AI analysis
Scatterplot Analysis: VIX High vs. Total Trade Count (2015)
Relationship Overview The scatterplot reveals a moderately strong positive relationship between the CBOE Volatility Index daily high (VIX High) and total trade count in U.S. equities markets throughout 2015. As VIX High values increase, total trade counts tend to rise correspondingly, which aligns with well-established market microstructure theory: elevated volatility typically drives heightened trading activity as market participants rebalance portfolios, execute hedges, or respond to price dislocations. The linear regression equation (y = 7.40×10⁻⁶x − 0.613) confirms a positive slope, though the intercept being slightly negative is a mathematical artifact of the linear fit rather than a meaningful economic statement.
Correlation Strength and Statistical Significance The Pearson correlation of r = 0.684 indicates a moderately strong positive association, and with r² = 0.468, approximately 46.8% of the variance in trade counts is explained by VIX High levels — a meaningful but clearly incomplete picture, leaving over half the variance attributable to other factors. The 95% confidence interval of [0.613, 0.745] is relatively narrow given the sample size of n = 252, and the p-value of essentially zero confirms this relationship is highly unlikely to be a statistical artifact. However, the Granger causality results are notably absent in both directions (X→Y: F = 0.0006, p = 0.980; Y→X: F = 0.0094, p = 0.923), meaning that despite the strong contemporaneous correlation, neither variable reliably predicts the other in the following period. This is a critical distinction: VIX and trade volume move together within the same day but do not lead or lag each other in a temporally predictive sense at a 1-period lag.
Patterns, Clusters, and Outliers The sample points reveal a notable clustering of observations at lower VIX values (roughly 997,371–2,500,000 range on the X-axis) with trade counts concentrated between 12 and 20, forming a dense core. Beyond approximately X = 3,000,000, the data becomes more dispersed, and several high-leverage points are visible — most strikingly, the point near (4,083,023, 38.06), which sits well above the regression line and likely corresponds to the late-August 2015 market selloff, when VIX spiked dramatically and trading volumes surged. Similarly, (3,907,922, 28.38) and (3,249,051, 28.33) represent elevated-volatility episodes that pull the regression fit upward. The relationship also appears to exhibit a slight non-linear, fan-shaped dispersion — variance in trade counts increases as VIX rises, suggesting heteroscedasticity that a simple linear model may underfit at extremes.
Confounding Factors and Caveats Several important caveats apply. First, both variables are likely driven by common external shocks — macroeconomic announcements, geopolitical events, or Federal Reserve communications in 2015 (e.g., China currency devaluation in August, Fed rate hike anticipation) would simultaneously spike VIX and drive trading volume, creating a spurious-looking causal link. Second, the dataset covers only a single calendar year (2015), limiting generalizability; 2015 was a notably volatile year, and results may differ substantially in calmer or more turbulent regimes. Third, trade count (number of transactions) and notional volume may diverge — high-frequency trading can inflate trade counts even during moderate VIX environments. Finally, the column labeling appears potentially swapped between datasets (VIX data providing trade counts; market volume data providing VIX), which warrants verification before drawing firm conclusions.
Actionable Insights and Further Investigation Practitioners could use the contemporaneous VIX-volume relationship for intraday liquidity modeling — anticipating that elevated VIX environments require wider market impact assumptions — though the Granger results caution against using yesterday's VIX to forecast today's volume in isolation. Further investigation should include: (1) testing non-linear models (logarithmic or piecewise regression) given the apparent heteroscedasticity; (2) extending the time series across multiple years and volatility regimes to test robustness; (3) controlling for day-of-week effects, earnings seasons, and macro announcement days as potential confounders; and (4) decomposing trade count by exchange or trade type to determine whether the VIX relationship is driven primarily by institutional hedging flows, retail activity, or algorithmic responses to volatility signals.
X dataset: Cboe U.S. Equities Historical Market Volume Data 2015
Y dataset: VIX Daily Index
Part of experiment: Daily - Cboe U.S. Equities Historical Market Volume Data 2015 vs VIX Daily Index