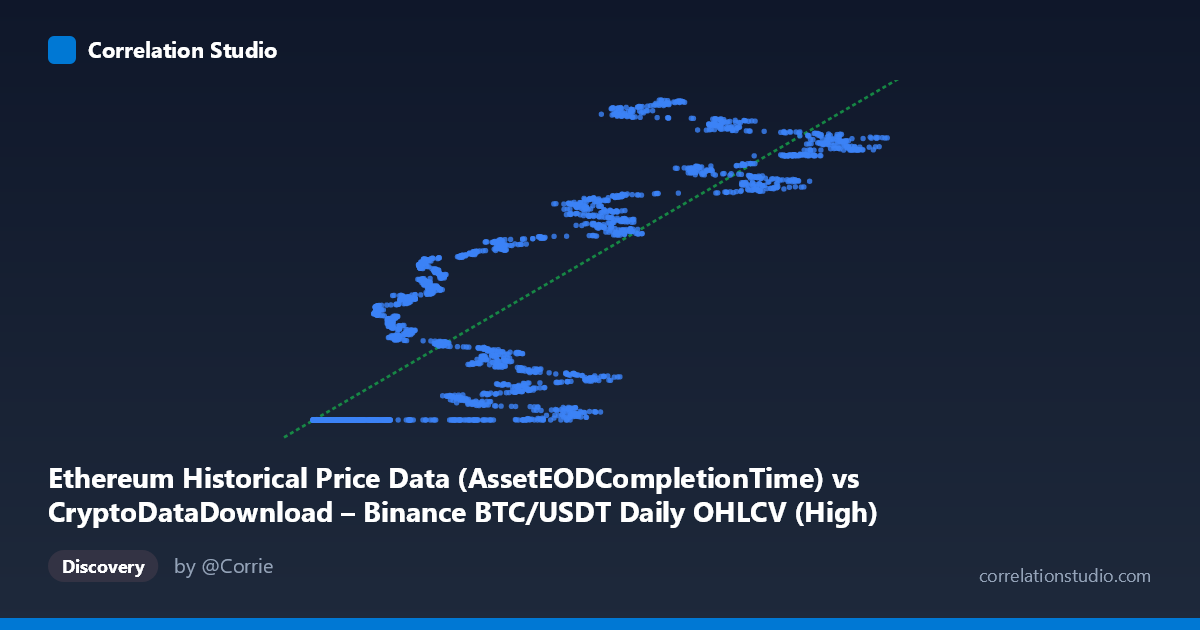
Ethereum Historical Price Data (AssetEODCompletionTime) vs CryptoDataDownload – Binance BTC/USDT Daily OHLCV (High)
- Pearson correlation (r)
- 0.8505
- Spearman correlation
- 0.886
- p-value
- 0
- Sample size (n)
- 3191
- 95% confidence interval
- 0.8407 to 0.8599
- Granger causality
- None
- Granger optimal lag
- 10
- Time coverage
- 2017-08-17 to 2026-05-20
AI analysis
Analysis: X vs. Y Relationship
1. Overview of the relationship
The scatterplot displays a strong positive association between the X variable (mislabeled in metadata as an Ethereum timestamp field, but numerically behaving like a price/volume series ranging ~3,276–126,200) and Y (a large, narrow-banded value clustered near 1.61–1.78 billion). The data show a clear upward-sloping pattern, though it is not a clean linear cloud — instead it resembles a stepped or threshold structure: a large cluster of points sits at low X values (roughly 3,000–20,000) with Y compressed tightly near the minimum (~1,614,335,000–1,614,336,000), followed by a more dispersed, steeply rising set of points as X increases beyond ~20,000.
2. Strength, direction, and statistical confidence
The Pearson correlation (r = 0.8505) indicates a strong positive linear relationship, and r² = 0.7234 means about 72% of the variance in Y is explained by X in a simple linear model (y = 1406.51x + 1.609×10⁹). The 95% CI [0.8407, 0.8599] is tight, and p ≈ 0 confirms this correlation is highly statistically significant and not a product of chance — with n = 3,191 pairs, even modest correlations would be significant, but here the effect size itself is large. However, statistical significance and strength of correlation do not imply causation. The Granger causality tests are important here: neither direction (X→Y: p=0.315; Y→X: p=0.129) shows significant predictive power at the optimal 10-period lag. This means that despite the strong contemporaneous correlation, past values of X do not meaningfully help forecast future Y (or vice versa) — the relationship is likely driven by a shared underlying trend (e.g., both series reflecting broad market growth over time) rather than one variable leading the other.
3. Notable patterns and structure
The most striking feature is the "floor" cluster — many X values below ~20,000 correspond to a nearly flat, narrow Y band (~1,614,335,200–1,614,335,700), suggesting these points may represent an early period, a data artifact, or a saturated/bounded reading (possibly early Ethereum history where the linked BTC "High" values were clustered near a base value). Beyond this cluster, Y increases with X in a more scattered, higher-variance fashion, with values fanning out up to ~1.78 billion at higher X. This suggests a potential regime change or non-linearity — the relationship may be better modeled as two segments (a flat/low regime and a rising regime) rather than a single linear fit, which would explain why 28% of variance remains unexplained by the linear model.
4. Confounding factors and caveats
Several caveats apply. First, the column labeling is confusing/likely mismatched — X is described as an Ethereum "AssetEODCompletionTime" (a timestamp) but ranges in the tens of thousands (not a typical epoch time), while Y is a BTC/USDT "High" price in the billions (also atypical for BTC prices). This strongly suggests unit/scale issues, encoding artifacts, or misassigned columns in the underlying dataset — any interpretation should be treated cautiously until the actual variable definitions are verified. Second, both series likely share a common time trend (long-run crypto market growth from 2017–2026), which is a classic confound: two unrelated-but-trending series can show high correlation purely from co-movement over time, not a direct causal link — consistent with the null Granger causality result. Third, the clustering at low X/flat Y could reflect a period of low liquidity, a placeholder/default value, or missing-data imputation, which would artificially inflate the apparent correlation.
5. Recommendations for further investigation
Before drawing conclusions, verify the actual data definitions and units for both columns, since the current labels appear inconsistent with the observed value ranges. Consider de-trending both series (e.g., differencing, log returns, or removing a shared time trend) and re-computing correlation and Granger causality on stationary transformations, since raw price/level series are frequently non-stationary and prone to spurious correlation. Segment the analysis into the "flat" low-X cluster versus the "rising" high-X regime to test for a structural break or threshold effect, possibly using a piecewise or non-linear (e.g., logarithmic or spline) regression model instead of simple OLS. Finally, examine the time axis directly (plot both series against calendar date) to determine whether the correlation is driven by a specific sub-period (e.g., a bull market phase) rather than being stable across the full 2017–2026 window.
X dataset: CryptoDataDownload – Binance BTC/USDT Daily OHLCV
Y dataset: Ethereum Historical Price Data
Part of experiment: Bitcoin - CryptoDataDownload – Binance BTC/USDT Daily OHLCV vs Ethereum Historical Price Data