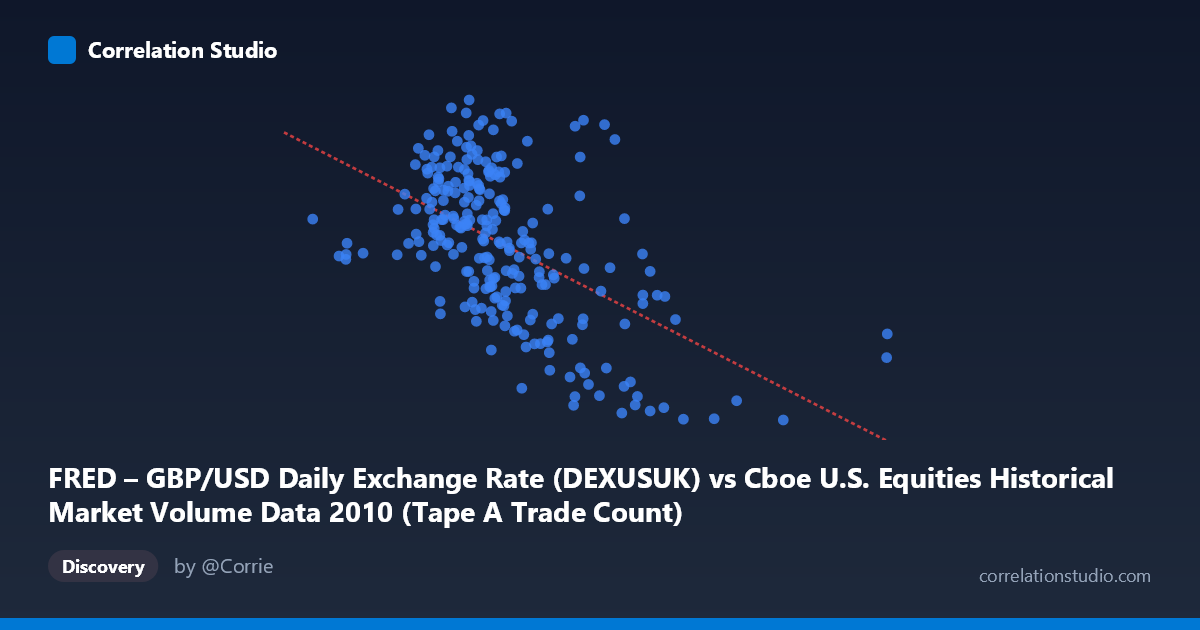
FRED – GBP/USD Daily Exchange Rate (DEXUSUK) vs Cboe U.S. Equities Historical Market Volume Data 2010 (Tape A Trade Count)
- Pearson correlation (r)
- -0.5357
- Spearman correlation
- -0.515
- p-value
- 0
- Sample size (n)
- 249
- 95% confidence interval
- -0.6188 to -0.4408
- Granger causality
- None
- Granger optimal lag
- 1
AI analysis
Scatterplot Analysis: GBP/USD Exchange Rate vs. Cboe Equity Trade Count (2010)
Relationship Overview The scatterplot reveals a moderate negative relationship between Cboe U.S. equity trade counts (X-axis) and the GBP/USD daily exchange rate (Y-axis) across 249 trading days in 2010. As equity trading volume increases, the pound tends to trade at a lower value against the dollar. The linear regression equation (y = -6.55×10⁻⁸x + 1.632) confirms this downward slope, suggesting that each additional million trades is associated with a modest but measurable decline in the exchange rate. Visually, the data points form a loose, downward-sloping cloud, indicating a real but imperfect relationship with substantial scatter around the trend line.
Correlation Strength and Statistical Significance The Pearson correlation of r = -0.5357 indicates a moderate negative association, but the explanatory power is limited: r² = 0.287, meaning only about 28.7% of the variance in GBP/USD is explained by trade count. The remaining ~71% is driven by factors not captured in this model. The 95% confidence interval of [-0.619, -0.441] is entirely negative and reasonably tight for a sample of n = 249, and the p-value of effectively 0 confirms this correlation is highly unlikely to be a chance artifact in the sample. However, the Granger causality results are notably absent in both directions — neither X→Y (F = 0.513, p = 0.474) nor Y→X (F = 3.081, p = 0.081) clears the conventional significance threshold. This is a critical finding: while the variables are statistically correlated, neither demonstrably predicts the other in a temporal, lead-lag sense, undermining any causal narrative.
Notable Patterns and Outliers Several features stand out in the data. There is a visible cluster of high-volume days (X 1,800,000) that consistently correspond to lower GBP/USD values (approximately 1.43–1.50), pulling the regression line downward at the right tail. Conversely, lower-volume days (X < 1,100,000) show greater vertical dispersion, with GBP/USD ranging widely from roughly 1.50 to 1.64. A few apparent outliers — including a point near (378,827; ~1.58) at the far left extreme and points above (2,300,000; 1.44) at the right — could be exerting disproportionate leverage on the regression slope. The Y-axis range is notably compressed (1.43–1.64), meaning small absolute changes in the exchange rate are visually amplified.
Confounding Factors and Caveats This correlation almost certainly reflects shared macroeconomic drivers rather than a direct mechanistic link between trade counts and sterling valuation. The year 2010 was characterized by post-financial-crisis volatility, eurozone sovereign debt concerns spilling into GBP, and episodic risk-off/risk-on equity trading surges — all of which could simultaneously depress GBP and spike U.S. equity volumes during stress events. This common-cause confounding (e.g., global risk sentiment) is the most plausible explanation for the observed correlation. Additionally, the axis labels appear to be swapped in the dataset metadata (each dataset's column is attributed to the other), which warrants verification before drawing any firm conclusions. The single-year window further limits generalizability.
Actionable Insights and Further Investigation Given the absence of Granger causality, practitioners should resist using equity trade counts as a predictive signal for GBP/USD in short-term forecasting models. Instead, the more productive path is to investigate the common driver hypothesis by introducing a risk-sentiment proxy (e.g., VIX, credit spreads, or S&P 500 returns) as a control variable to test whether the correlation attenuates or disappears. Extending the analysis across multiple years would reveal whether this relationship is structural or idiosyncratic to 2010's macro environment. A rolling-window correlation analysis could also identify whether the negative relationship strengthens during specific stress regimes, which would have value for regime-conditional hedging strategies linking equity exposure to currency risk.
X dataset: Cboe U.S. Equities Historical Market Volume Data 2010
Y dataset: FRED – GBP/USD Daily Exchange Rate
Part of experiment: Daily - Cboe U.S. Equities Historical Market Volume Data 2010 vs FRED – GBP/USD Daily Exchange Rate