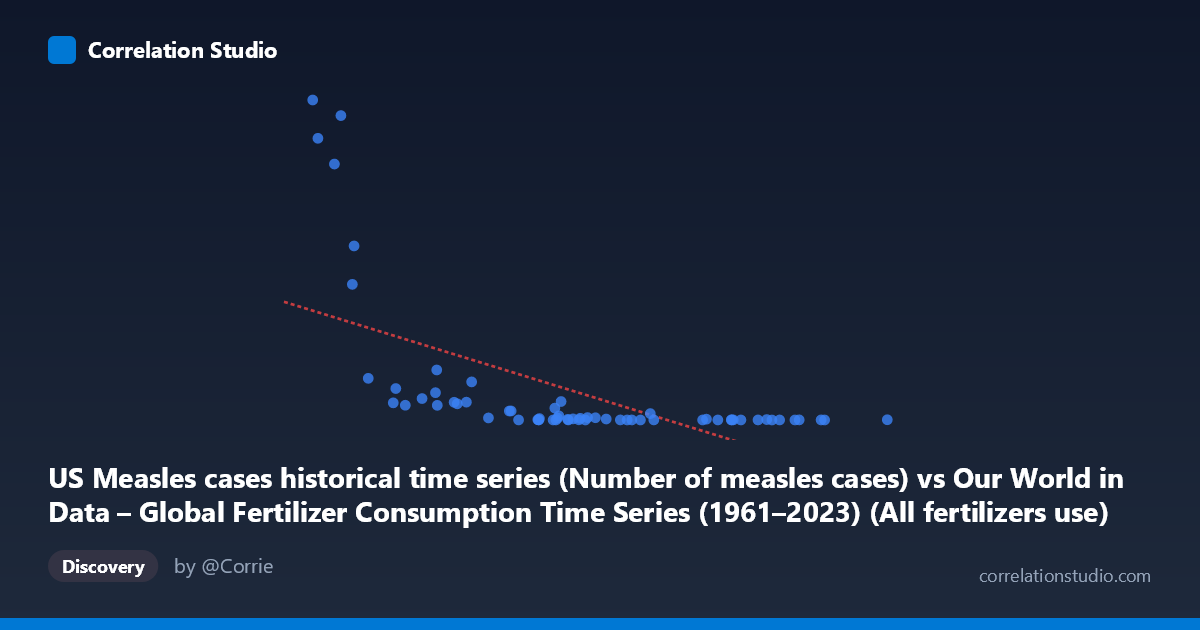
US Measles cases historical time series (Number of measles cases) vs Our World in Data – Global Fertilizer Consumption Time Series (1961–2023) (All fertilizers use)
- Pearson correlation (r)
- -0.5976
- Spearman correlation
- -0.7777
- p-value
- 0
- Sample size (n)
- 63
- 95% confidence interval
- -0.7364 to -0.4107
- Granger causality
- None
- Granger optimal lag
- 10
- Time coverage
- 1961-01-01 to 2023-01-01
- Recomputed on refreshed data
- 2026-10-18 (r was -0.5976)
AI analysis
Scatterplot Analysis: US Measles Cases vs. Global Fertilizer Consumption
1. Overall Relationship Revealed
The scatterplot reveals a negative association between global fertilizer consumption (X-axis) and US measles cases (Y-axis), meaning that as fertilizer use has grown over the 1961–2023 period, reported US measles cases have generally declined. The linear regression equation (y = −0.0136x + 207,527) captures this downward trend, but the data points are far from tightly clustered around this line. Instead, the distribution shows a pronounced concentration of low-Y values at higher X values, with a dramatic spread of high-Y values confined to the left (lower X) portion of the chart. This visual asymmetry immediately signals that a simple linear model is likely an imperfect descriptor of the underlying pattern, and the note that Spearman ρ exceeds Pearson r formally confirms that a non-linear (logarithmic or exponential decay) relationship likely fits the data substantially better.
2. Correlation Strength, Direction, and Temporal Predictive Power
The Pearson correlation of r = −0.5976 indicates a moderate negative correlation, but the explanatory power deserves careful framing: R² = 0.3572 means that only ~35.7% of the variance in US measles cases is statistically explained by variation in global fertilizer consumption. Roughly two-thirds of the variance remains unaccounted for by this relationship alone. The 95% confidence interval for r spans [−0.7364, −0.4107], a moderately wide range that nonetheless excludes zero entirely, and the p-value of 2.33 × 10⁻⁷ confirms the correlation is highly statistically significant — this is not a chance association in a purely statistical sense. However, statistical significance must not be confused with causal or practical significance. Critically, the Granger causality analysis finds no significant predictive direction in either direction (X→Y: F = 1.96, p = 0.073; Y→X: F = 1.03, p = 0.439), meaning that past values of fertilizer consumption do not significantly help predict future measles cases, and vice versa. This is a strong caution against any causal interpretation.
3. Notable Patterns, Clusters, and Outliers
Several features stand out visually:
- High-leverage outliers in the upper-left quadrant: Points such as (3,156,855; 481,530), (4,117,716; 458,083), (3,333,884; 423,919), and (3,896,899; 385,156) represent early years (likely 1961–early 1970s) with low fertilizer use and extremely high measles cases — these points exert substantial influence on the regression slope and correlation coefficient. - Dense cluster near the X-axis at high X values: The majority of points at X 10,000,000 have Y values below ~15,000, forming a tight, flat band suggesting measles cases effectively plateaued near zero after vaccination achieved broad coverage regardless of fertilizer levels. - Non-linear decay structure: The data strongly resembles an exponential or hyperbolic decay curve rather than a linear decline — the steep drop in measles cases occurs over a relatively narrow historical window, after which values remain low and largely invariant to further fertilizer increases. This is precisely why Spearman ρ outperforms Pearson r here. - Mid-range anomalies: A few points (e.g., ~14,666,559; 9,643 and ~16,581,872; 1,274) show elevated measles counts at relatively high X values, possibly corresponding to the 1989–1991 US measles resurgence, representing genuine biological/epidemiological events.
4. Confounding Factors and Critical Caveats
The most important caveat is that this correlation almost certainly reflects shared temporal trends rather than any mechanistic relationship between fertilizer consumption and measles cases. Both variables are time-indexed (1961–2023), and the true driver of declining measles cases is well-established: the introduction of the measles vaccine in 1963 and subsequent national immunization campaigns. Fertilizer consumption has grown globally over the same decades for entirely unrelated economic and agricultural reasons. This is a textbook example of spurious correlation driven by confounding time trends — both series trend strongly over the 20th century in opposite directions, generating a statistically significant but causally meaningless correlation. Additional confounders include: population growth (affecting both agricultural demand and disease susceptibility pools), improvements in healthcare infrastructure, changes in reporting methodology for measles cases, and geopolitical disruptions affecting agricultural supply chains. The Granger causality result — finding no significant temporal predictive relationship — reinforces this interpretation, as a genuine causal mechanism would typically manifest in lagged predictive power.
5. Actionable Insights and Further Investigation
Given the findings, several analytical directions are warranted:
- Fit a non-linear model: A logarithmic regression (ln(Y) ~ X) or exponential decay model should be tested and compared via AIC/BIC, as the Spearman-Pearson discrepancy strongly suggests this would better capture the data structure. - Partial out the time trend: Running a partial correlation controlling for year would be the most informative next step — if the r drops to near zero after removing the shared time trend, this confirms the relationship is spurious. - Introduce vaccination coverage as a covariate: Incorporating measles vaccination rates (e.g., from WHO/CDC data) would allow a proper multivariate test of what actually drives measles case counts, and would almost certainly absorb most of the variance currently attributed to fertilizer consumption. - Investigate the mid-period resurgence: The elevated measles data points at higher X values (likely 1989–1991) should be flagged and examined separately — they represent a real epidemiological event and may warrant exclusion or segmented analysis when modeling long-run trends. - Conduct the analysis with explicit year as a variable: A time-series regression with autoregressive terms or a change-point model at 1963 (vaccine introduction) would provide a far more honest statistical characterization of this dataset.
Summary verdict: The moderate negative correlation (r = −0.60, R² = 0.36) is statistically significant but almost certainly spurious, driven by coincident long-run time trends. The lack of Granger causality, the non-linear data structure, and the well-understood causal history of measles vaccination all counsel strongly against any substantive interpretation of this association.
X dataset: Our World in Data – Global Fertilizer Consumption Time Series (1961–2023)
Y dataset: US Measles cases historical time series
Part of experiment: Yearly - Our World in Data – Global Fertilizer Consumption Time Series (1961–2023) vs US Measles cases historical time series