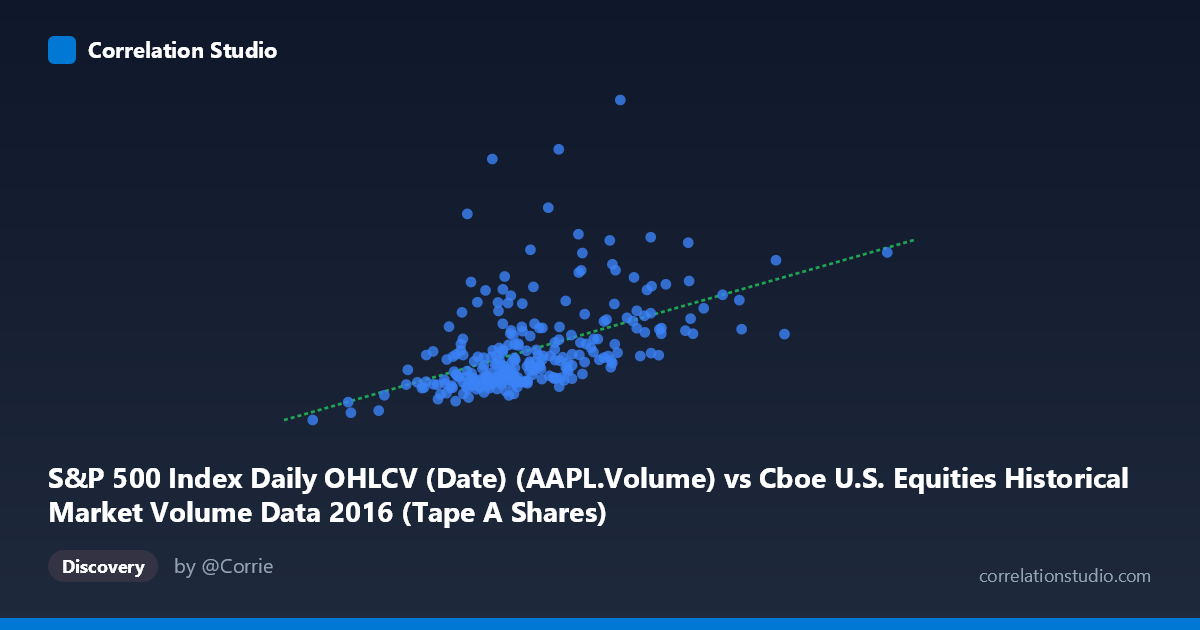
S&P 500 Index Daily OHLCV (Date) (AAPL.Volume) vs Cboe U.S. Equities Historical Market Volume Data 2016 (Tape A Shares)
- Pearson correlation (r)
- 0.4919
- Spearman correlation
- 0.5726
- p-value
- 0
- Sample size (n)
- 252
- 95% confidence interval
- 0.3922 to 0.5802
- Granger causality
- None
- Granger optimal lag
- 10
AI analysis
Scatterplot Analysis: AAPL Trading Volume vs. Cboe Tape A Shares (2016)
Relationship Overview The scatterplot reveals a moderate positive relationship between Apple Inc.'s daily trading volume (S&P 500 OHLCV dataset, X-axis) and Cboe U.S. Equities Tape A share volume (Y-axis) across 252 trading days in 2016. As AAPL volume increases, Tape A shares tend to rise as well, consistent with the fitted linear regression line y = 0.142944x − 535,927. However, the scatter is notably wide, indicating that while a directional tendency exists, AAPL volume alone is far from a reliable predictor of broader Tape A activity. The X values cluster heavily between ~200M and ~350M shares, while Y values show considerably more vertical dispersion at any given X level, suggesting heteroscedasticity — the spread in Y appears to widen at higher X values.
Correlation Strength and Statistical Interpretation The Pearson correlation of r = 0.4919 indicates a moderate positive association, but the more telling figure is r² = 0.2420, meaning AAPL volume explains only 24.2% of the variance in Tape A shares — leaving roughly 75.8% of variability unexplained by this single predictor. The 95% confidence interval for r of [0.3922, 0.5802] is meaningfully above zero and reasonably tight given the sample size (n = 252), lending confidence that the relationship is real and not artifactual. The p-value of effectively 0 confirms strong statistical significance, ruling out chance as an explanation. However, statistical significance should not be conflated with practical importance: a relationship can be highly significant yet explain only a modest fraction of real-world variance, which is precisely the case here. Crucially, Granger causality tests in both directions (X→Y: F = 0.9905, p = 0.4525; Y→X: F = 0.9499, p = 0.4884) are non-significant at the optimal 10-period lag, meaning neither variable temporally predicts the other — the correlation reflects co-movement, not a leading/lagging relationship useful for forecasting.
Notable Patterns, Clusters, and Outliers Several features stand out visually. The bulk of observations form a loose central cloud concentrated between 220M–320M on the X-axis and 25M–55M on the Y-axis, suggesting a "typical trading day" regime. However, there are clear high-leverage outliers: one point near X ≈ 340M with Y ≈ 133M (far above the regression line), and another near X ≈ 285M with Y ≈ 92M — both represent days of extreme Tape A activity that the model substantially underpredicts. There also appear to be a few points at the lower-left (e.g., X ≈ 177M, Y ≈ 25M) representing unusually quiet days. These outliers, likely corresponding to event-driven market days (earnings, macro shocks, or geopolitical events in 2016 such as the Brexit vote or U.S. election), exert disproportionate influence on the regression slope and the correlation coefficient. Removing these extreme Y values would likely reduce r meaningfully and alter the regression parameters.
Confounding Factors and Caveats Several confounds complicate causal interpretation. First, both variables are market-wide volume metrics — AAPL as a mega-cap S&P 500 constituent naturally co-moves with broad market activity, so the correlation may largely reflect shared exposure to market-wide volume cycles (e.g., end-of-quarter rebalancing, VIX spikes, index reconstitutions) rather than any AAPL-specific effect. Second, the dataset labels appear cross-swapped: the X-axis is labeled as coming from the Cboe dataset but contains AAPL volume, and the Y-axis is labeled from the S&P 500 OHLCV dataset but contains Tape A shares — this metadata inconsistency warrants verification before drawing conclusions. Third, time-series autocorrelation within both variables (common in financial volume data) inflates effective sample size estimates and can make p-values appear more significant than warranted under i.i.d. assumptions. The absence of Granger causality at 10 lags is reassuring but does not rule out contemporaneous confounding via a common driver such as the CBOE VIX or macro news flow.
Actionable Insights and Further Investigation Practitioners should not use AAPL volume as a standalone predictor of Tape A activity given the weak explanatory power (24.2% R²) and absence of temporal predictability. A more productive path would be to: (1) include additional large-cap volume series (e.g., MSFT, AMZN, SPY ETF) in a multivariate model to assess whether the correlation strengthens significantly; (2) test for regime changes around known 2016 events (Brexit: June 23, U.S. election: November 8) by splitting the sample and comparing correlations across sub-periods; (3) apply autocorrelation-robust standard errors (Newey-West) to re-evaluate the confidence interval more conservatively; and (4) investigate the extreme outlier days (especially Y ≈ 133M) to determine whether they represent data anomalies or genuinely informative market stress events that could be modeled separately. A rolling correlation analysis over 30- or 60-day windows would also reveal whether the moderate r = 0.49 is stable across the year or driven by a few high-volatility periods.
X dataset: Cboe U.S. Equities Historical Market Volume Data 2016
Y dataset: S&P 500 Index Daily OHLCV (Date)
Part of experiment: Daily - Cboe U.S. Equities Historical Market Volume Data 2016 vs S&P 500 Index Daily OHLCV (Date)