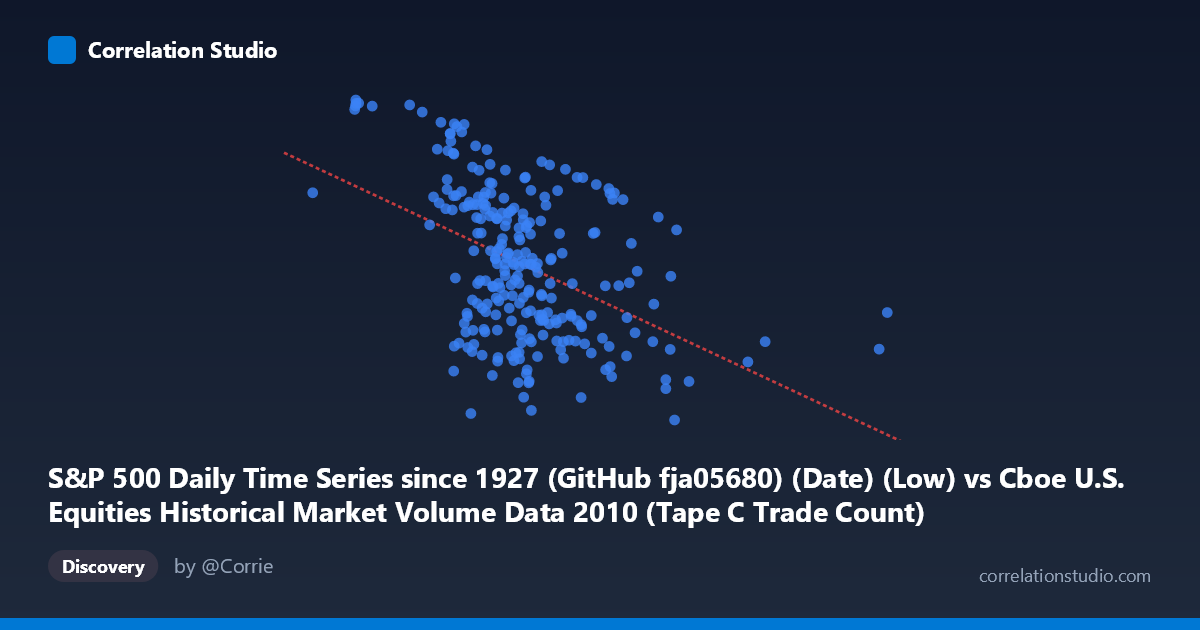
S&P 500 Daily Time Series since 1927 (GitHub fja05680) (Date) (Low) vs Cboe U.S. Equities Historical Market Volume Data 2010 (Tape C Trade Count)
- Pearson correlation (r)
- -0.4542
- Spearman correlation
- -0.4326
- p-value
- 0
- Sample size (n)
- 252
- 95% confidence interval
- -0.5471 to -0.3503
- Granger causality
- Y → X
- Granger optimal lag
- 1
AI analysis
Analysis: S&P 500 Daily Low vs. Cboe Tape C Trade Count (2010)
Relationship Overview The scatterplot reveals a moderate negative relationship between the S&P 500 daily low price (X-axis) and the Cboe Tape C trade count (Y-axis) across 252 trading days in 2010. The linear regression equation y = -0.00017259x + 1,237.5 indicates that as the S&P 500 daily low increases, the number of Tape C trades tends to decrease. Visually, this manifests as a downward-sloping cloud of points, with higher trade counts clustering at lower index price levels (roughly 400,000–600,000 range) and lower trade counts appearing more frequently as the index low rises toward 800,000–1,400,000. The relationship is real but clearly not deterministic, with considerable scatter throughout.
Correlation Strength and Statistical Significance The correlation coefficient r = -0.4542 indicates a moderate negative association, but the more informative metric is r² = 0.2063 — meaning only 20.6% of the variance in Tape C trade counts is explained by the S&P 500 daily low. The remaining ~79% is driven by factors outside this model. The 95% confidence interval for r of [-0.5471, -0.3503] is notably narrow and does not cross zero, and the p-value of 3.131×10⁻¹⁴ confirms the relationship is highly statistically significant across the population of N = 3,302 observations (with n = 252 paired samples used here). Critically, the Granger causality analysis points to a unidirectional temporal relationship: Y Granger-causes X (F = 4.471, p = 0.0355) with an optimal lag of 1 period, while X does not significantly Granger-cause Y (F = 2.588, p = 0.109). This suggests that Tape C trade count activity may have modest short-term predictive power for next-day S&P 500 price levels, rather than the reverse — an economically plausible finding given that order flow and trading activity can precede price discovery.
Notable Patterns, Clusters, and Outliers Several structural features stand out in the data. There is a dense cluster of points in the X range of approximately 450,000–700,000 with Y values spanning roughly 1,060–1,200, reflecting the bulk of 2010 trading activity during periods of moderate index levels. At the upper extreme, the point at approximately (1,379,287, 1,094) appears as a clear right-side outlier in the X dimension — likely corresponding to a high-volatility day with an unusually wide intraday range. Similarly, a few points at lower X values (e.g., ~298,000–380,000) show notably high trade counts approaching 1,254–1,255, consistent with high-activity periods during market stress or recovery phases early in the year. The spread in Y values for any given X range is substantial (often 100–150 trade count units), reinforcing that the linear model captures only a partial picture.
Confounding Factors and Caveats Several important caveats apply. First, reverse causality is possible: higher market uncertainty (reflected in lower price lows) may simultaneously drive both higher trading volumes and lower index levels, making the observed correlation partially spurious. Second, 2010 was a distinctive year — it included the May 6 "Flash Crash," European sovereign debt concerns, and Federal Reserve quantitative easing, all of which could create structural breaks that inflate apparent correlations. Third, the S&P 500 "Low" is an intraday measure of price extremity rather than a closing or average price, making it a noisy and potentially unrepresentative proxy for general market level. Fourth, Tape C specifically covers NYSE Arca-listed securities, so this trade count does not represent total market volume, limiting generalizability. Finally, while Granger causality is suggestive, it measures temporal precedence, not true causation, and the effect size (F = 4.471) is modest.
Actionable Insights and Further Investigation Despite the moderate explanatory power, the Granger causality finding — that Tape C trade counts may predict next-day S&P 500 lows — warrants deeper exploration. Analysts could investigate whether incorporating lagged trade count data improves short-term index forecasting models, particularly for intraday low estimation which is relevant to risk management and stop-loss calibration. It would be valuable to segment the analysis by market regime (pre/post Flash Crash, high/low VIX environments) to determine whether the correlation is consistent or driven by specific episodes. Additionally, expanding to Tape A and Tape B trade counts alongside Tape C could reveal whether the relationship is exchange-specific or market-wide. Finally, testing this correlation in subsequent years (2011–2015) would clarify whether this is a structural feature of market microstructure or an artifact of 2010's unique conditions.
X dataset: Cboe U.S. Equities Historical Market Volume Data 2010
Y dataset: S&P 500 Daily Time Series since 1927 (GitHub fja05680) (Date)
Part of experiment: Daily - Cboe U.S. Equities Historical Market Volume Data 2010 vs S&P 500 Daily Time Series since 1927 (GitHub fja05680) (Date)